 In recent blogs I have looked at policy outcomes, voting records and policy-makers’ connections to analyse whether the UK is ‘marginalised’ in the EU Council. But the Council is only half of the EU’s bicameral legislature. The other half is the European Parliament, which now has the power to amend and block EU laws in almost all policy areas. So, are UK Members of the European Parliament (MEPs) marginalised?
A good starting point are the MEPs’ voting records (on www.VoteWatch.eu), and there are a lot of them: there were 6,149 such votes in the 2004-09 session (EP6); 6,961 in 2009-14 (EP7); and there have been 2,306 since June 2014 in the current session (EP8).[1] From these records we can see whether UK MEPs and parties tend to be on the winning or losing side in votes, and whether our MEPs and parties vote with or against the European political groups to which they belong.
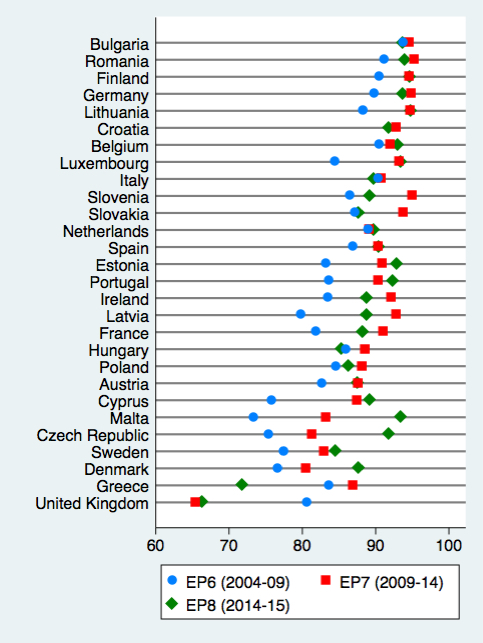
Note: A member state’s delegation of MEPs was calculated as being on the ‘winning side’ in a vote if the plurality of the MEPs from the member state voted the same way as the majority of all MEPs in the vote.
To start with, Figure 1 shows the percentage of times each member state’s MEPs were on the ‘winning side’ in all votes in EP6, EP7 and EP8. The first thing to note is that the average is high: about 85%. This is because many votes are highly consensual. Nevertheless, there is significant variation between the member states: from 93% for Finnish MEPs (and even higher for Bulgarian and Romanian MEPs, who joined in 2007), to only 71% for British MEPs. Also, while British MEPs were reasonably successful in EP6, since 2009 they have been less likely to be on the winning side than the MEPs from any other member state.
But voting in the European Parliament is mainly along political group lines not national lines, with higher group voting cohesion than the Democrats and the Republicans in the US Congress. Hence, what determines whether an MEP is on the winning or losing side is which political group she belongs to and whether she follows her group’s voting positions.
Figure 2 hence shows the ‘winning rates’ of the political groups, from left to right. Although the Liberals (ALDE) where the third largest group in EP6 and EP7, and are the fourth largest in EP8, they have been on the winning side most frequently because they are pivotal: critical for a winning majority either on the left (with S&D, G/EFA, and GUE) or on the right (with EPP and UEN or ECR). The two largest groups either side of the Liberals (S&D and EPP) also play a dominant role (on the winning side almost 90% of the time), while the groups further to left and right are significantly less likely to win votes.
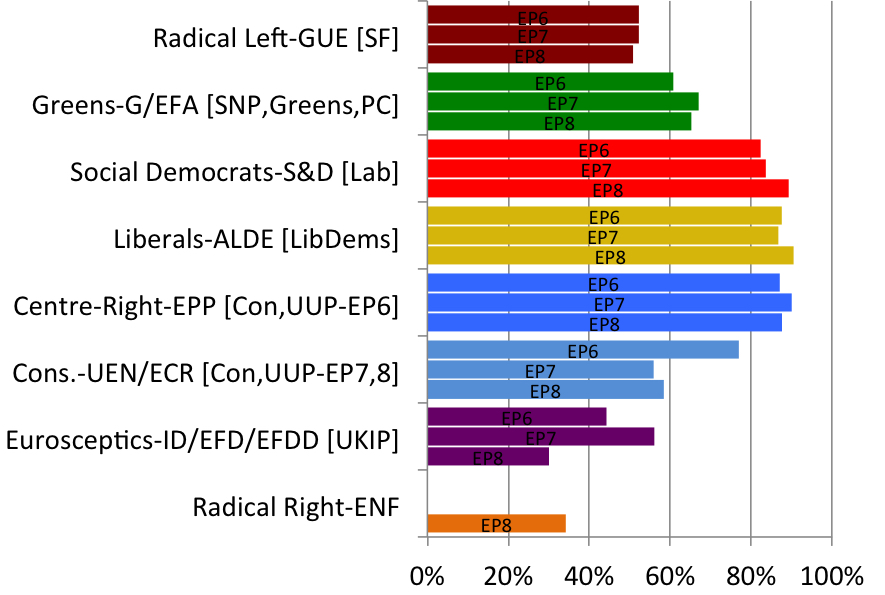
ALDE = Alliance of Liberals and Democrats for Europe, EPP = European People’s Party, UEN = Union for Europe of the Nations, ECR = European Conservatives and Reformists, ID = Independence/Democracy, EFD = Europe of Freedom and Democracy, EFDD = Europe of Freedom and Direct Democracy, ENF = Europe of Nations and Freedoms.
GB parties indicated in parentheses. The BNP and DUP MEPs have sat as ‘non-attached’ members.
Only the Labour Party (in S&D) and the Liberal Democrats (in ALDE) sit in these dominant groups. The Conservatives left EPP in 2009, to form ECR. ECR was on the winning side only 56% of the time in EP7 and 58% so far in EP8. Also, the Eurosceptic groups (ID, EFD and EFDD), where UKIP sit, have voting against the majority in most votes since 2004, while G/EFA, where the Greens, SNP and Plaid Cymru sit, have won in only 64% of votes since 2004.
In addition, Labour and Lib Dem MEPs have lost seats while the Conservatives and UKIP have won seats. As a result, the number of UK MEPs in the three main groups (EPP, S&D and ALDE) has fallen from 31 out of 75 MEPs (41%) in 2004 to 21 out of 73 (29%) in 2015. Not surprisingly, then, UK MEPs are more marginalised than they were before.
Then, within their political groups, UK MEPs often vote against their groups’ positions. As Figure 3 shows, in 2009-14 the Conservatives, who dominated ECR, voted with the group majority in almost every vote. In 2004-09, though, when the Conservatives were in EPP, they only voted with the EPP majority 74% of the time. Is being the dominant party in a marginalised group (ECR), better than being a marginalised party in a dominant group (EPP)? Not sure.
Meanwhile, in 2009-14, Labour MEPs often vote against the S&D position, as did UKIP in EFD, and SNP in G/EFA. Only the Lib Dems and Greens were more likely to follow group instructions than the average member of their groups.
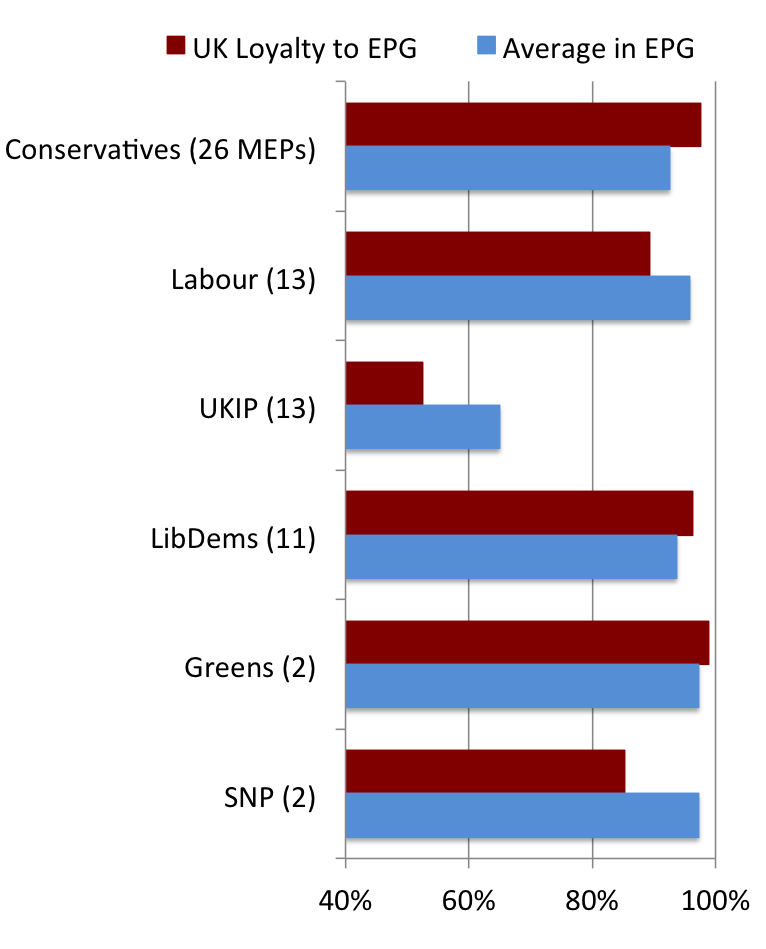
Note: This figure only shows MEPs from parties that had at least 2 MEPs in the 2009-14 session and were members of a political group. In addition to these MEPs, there was 1 MEP from Plaid Cymru (in G/EFA), 1 UUP (in ECR), 1 Sinn Fein (in GUE), and 2 BNP and 1 DUP (who sat as non-attached members).
Another way to see the challenge for British parties is to compare them to parties from the other large countries plus some of the UK’s allies in the Council (Netherlands, Sweden, and Denmark) – see Figure 4.
The combination of sitting in a marginalised group (ECR and EFDD) plus voting against the position of the majority of a group (Labour in S&D) means that UK parties are considerably less likely to be on the winning side than other national parties. The only exception are the UK Lib Dems, who where an influential party in the pivotal group before they lost all but one of their MEPs in 2014. Interestingly, though, some parties from the UK’s allies are also relatively marginalised. The Swedish Conservatives are less likely to win votes than any other major party in EPP, while the Danish and Swedish Social Democrats are even less likely to win votes than Labour.
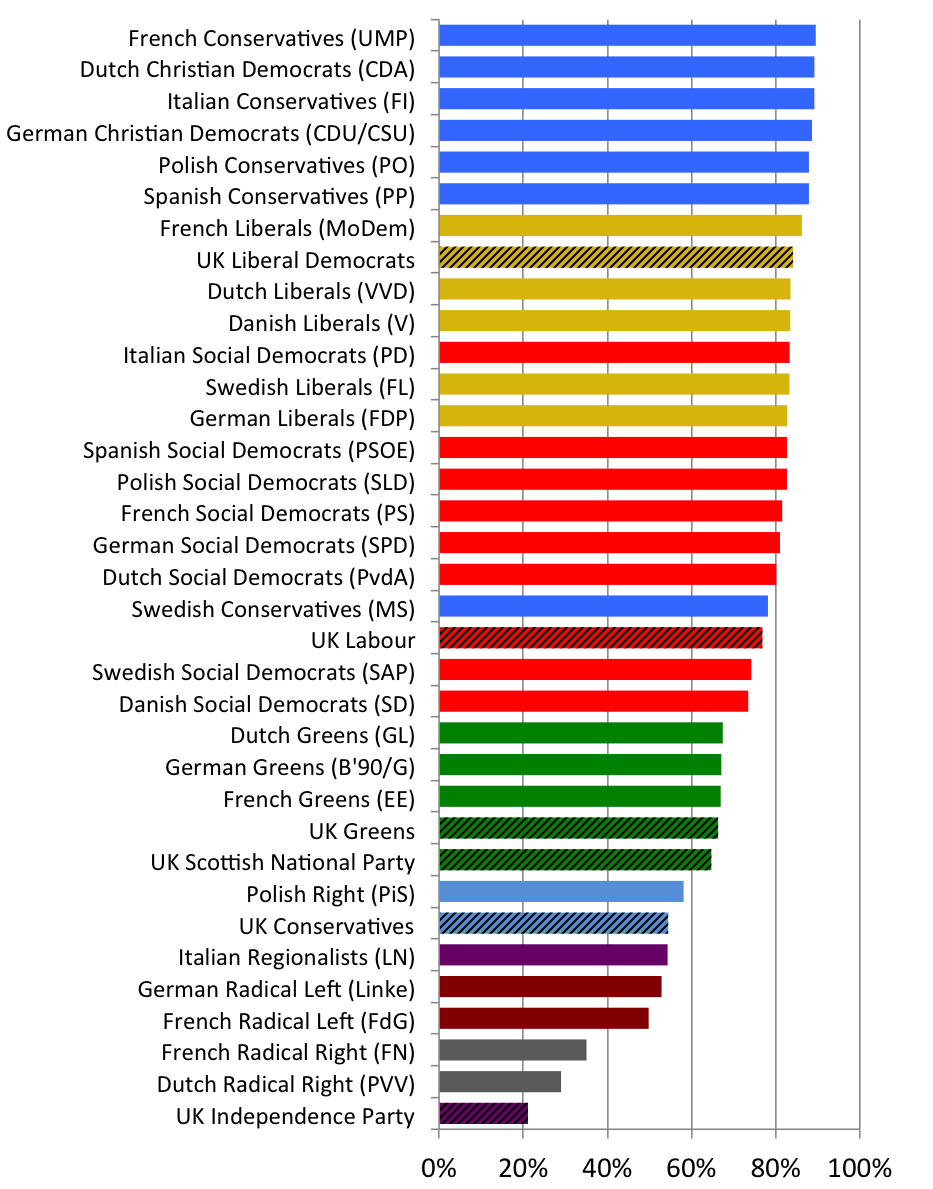
Note: A national party was calculated as being on the ‘winning side’ in a vote if the plurality of the MEPs from the party voted the same way as the majority of all MEPs in the vote. The parties are coloured according to their political group membership. UK parties are indicated with stripes.
Overall, European Parliament voting records suggest that the UK is in a weak position in this branch of the EU’s legislative system. Most British MEPs do not sit in the groups that dominate the European Parliament agenda. And even when they do sit in these groups – such as the Conservatives in EPP before 2009, and Labour in S&D – British MEPs are often opposed to the majority positions of these groups. As a result, British MEPs often find themselves on the losing side in key votes.
Nevertheless, these roll-call voting patterns do not tell the full story. How much do these patterns vary by policy area? And do UK MEPs capture some of the key agenda-setting positions in the European Parliament, such as committee chairs or rapporteurships? I will address these questions in the next two blogs.
[1] Not all votes in the European Parliament are by ‘roll-call’. Since 2009 all ‘final votes’ on legislative bills have been by roll-call, and a roll-call can be requested on any other vote by a political group or at least 40 MEPs (out of 751). These are low thresholds, which means that practically all important issues are held by roll-call.
This blog represents the views of the author and not those of the BrexitVote blog, nor the LSE.
Simon Hix is Harold Laski Professor of Political Science at the London School of Economics and Political Science and Senior Fellow on the ESRC’s UK in a Changing Europe programme.


