 One of Brexit’s potential advantages is the UK’s freedom to negotiate its own trade deals instead of being dependent on the EU. Of course, trade will continue with the EU after Brexit, probably little changed, and there is little doubt that the EU will continue to be a major trading partner after Brexit. But it is widely expected that the share of UK exports going to the EU will continue to decline, reflecting the maturity of the EU markets and the continuing decline of the EU’s share of global output. New deals are likely to be with countries as diverse as the US and Japan – and, of course, individual Commonwealth countries. Australia and Canada, for example, have already expressed interest in a free trade agreement. In this post, Ruth Lea, CBE (Arbuthnot Banking Group), explains why trading with the Commonwealth offers buoyant economic prospects.
 Image by CC BY-SA 4.0.
The current biennial Commonwealth Heads of Government Meeting (CHOGM), being held in London on 16-20 April, seems a suitable time to analyse the economic importance of Commonwealth countries and consider their potential as future growth markets for UK exports.
Commonwealth countries are rarely considered together as an economic entity. Yet they account for over 17% of world GDP in Purchasing Power Parity (PPP) terms (chart 1a) and contain 2.4 billion of the world’s 7½ billion people. Moreover, many Commonwealth countries have favourable demographics compared with several major European countries, where working populations are expected to age and shrink. Today’s 53-member Commonwealth spans the five continents and contains developed, emerging and developing economies. It also comprises some of the world’s largest economies and many of the smallest. In its diversity, it captures the character of the 21stcentury globalised economy as no other economic grouping can. The Commonwealth’s membership includes two of the world’s largest ten economies (the UK and India), two members of the G7 (Canada and the UK) and five members of the G20 (the UK, India, Canada, Australia and South Africa).
The Commonwealth: buoyant economic prospects
Charts 1a and 1b show the IMF’s latest forecasts to 2022 for EU28, the US, China and the Commonwealth in Purchasing Power Parities (PPPs) and at Market Exchange Rates (MERs).1-2 Chart 1a (in PPPs) shows just how profoundly the world economy has changed since 1980 and is projected to continue changing up to 2022. EU28 countries accounted for 30% of world GDP in 1980, whilst the US contributed nearly 22% and the Commonwealth contributed 15%. China’s share was just over 2%. By 2017, China had increased its share to over 18%, reflecting China’s staggering growth over the past 30 years, which exceeded the Commonwealth (over 17%), the EU28 (down to 16.5%) and the US (still over 15%). Crucially these trends are expected to continue to 2022, with China and the Commonwealth (not least of all because of India’s buoyant growth) expecting to gain share over the EU28 and the US.
Chart 1b (in MERs) shows how currency effects can affect the GDP data. For example, the strong dollar in 2000 “boosted” the US’s share (in MERs) to over 30%. Inevitably, the forecasts are dependent on forecasts of currency movements, which make them even more than usually non-robust. The decline in the EU28 share in MERs over the forecast period less pronounced than in PPPs because GDP in MERs favours developed countries. But, nevertheless, the global share had dropped from 34% in 1980 to 21½% in 2017 and is projected to slide further by 2022. The rise in the Commonwealth’s share is considerably dampened in MER terms, not least of all because the significance of India, where GDP in MER terms is significantly lower than in PPP terms. But it is still expected to more than hold its share.
Chart 1a Shares of world GDP (PPP terms), %
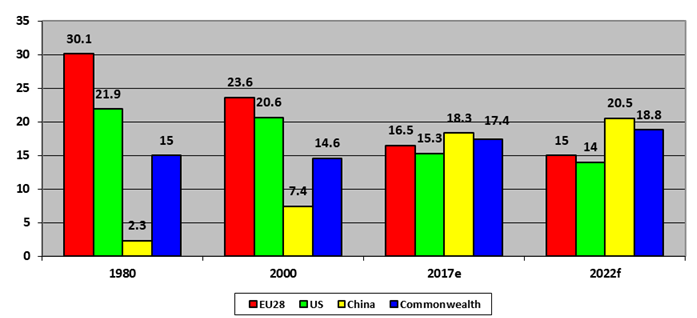
Chart 1b Shares of world GDP (MER terms), %
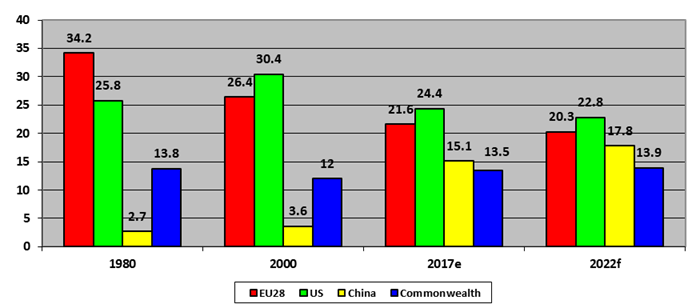
Source: IMF, World Economic Outlook, database, October 2017.
UK-Commonwealth trade
Given the relatively buoyant growth prospects in Commonwealth countries, UK export growth prospects to these countries should be favourable, especially if free trade agreements are successfully negotiated. There are two other general points worth noting. The first is the observation that, because of shared history and commonalities of language, law and business practice, it has been estimated that Commonwealth countries trading with one another experience business costs 10-15% lower than similar dealings with non-Commonwealth countries of comparable size and GDP. This has been called the “Commonwealth advantage”.3
The second point notes that the potential in any export market does not, of course, just reflect the size of the economy. It is also a matter of the relative incomes per capita in various export markets. Especially when it comes to consumer goods, potential consumers need to have the kind of disposable incomes that will allow them to buy the cars, televisions and other goods that have been staples of “middle class” life in the West for decades. And, on this metric, developed countries still have a very appreciable lead over emerging and developing countries. According to the IMF, income per capita was 7 times as high in Germany as in India in PPP terms in 2017, and 24 times as a high in MER terms. The corresponding figures for China were still as high as 3 times and 5 times respectively.
But, looking forward, the potential growth of the middle classes in the emerging markets, not least of all in India and China, is expected to change matters radically. A report by Ernst & Young (EY) on this issue concluded:4
- “…by 2030, so many people will have escaped poverty that the balance of geopolitical power will have completely changed – global trade patterns will be unrecognizable too. Meanwhile, companies accustomed to serving the middle-income brackets of the old Western democracies will need to decide how they can effectively supply the new bourgeois of Africa, Asia and beyond.”
- Specifically concerning China and India, EY said “…large populations and rapid economic growth mean China and India will become the powerhouses of middle class consumerism over the next two decades.”
Turning to the UK’s current trade with our major Commonwealth partners the main conclusion is that it is still relatively modest compared with the EU. This is not, of course, surprising given the relative size and wealth of many of the EU’s members. UK-Commonwealth trade is also modest relative to the US (especially) and, arguably, China. Clearly, there is potential for expansion.
Chart 2a shows exports grew by just over 31% to the top eight Commonwealth countries over the decade 2006-2016 compared with total export growth of 40%.5 Trade with India, Pakistan and South Africa, in particular, was disappointing. As a consequence, the share of UK exports to these eight Commonwealth destinations actually fell from 7.5% in 2006 to 7.0% in 2016. Commonwealth trade, nevertheless, outstripped the rise of just over 11% to the EU28. Exports to the US (which took over 18% of UK exports in 2016) were up over 55% and exports to China more than tripled, though from a very low base. Other buoyant non-EU markets included Switzerland, Saudi Arabia, the Residual Gulf Arabian Countries and Hong Kong. Chart 2b notes that, even if exports growth to the top eight Commonwealth countries over the past decade has been relatively subdued, at least overall trade has been in small surplus, whereas trade with the EU28 and China is heavily in deficit.
Chart 2a UK exports in goods and services, growth between 2006 & 2016 (%)
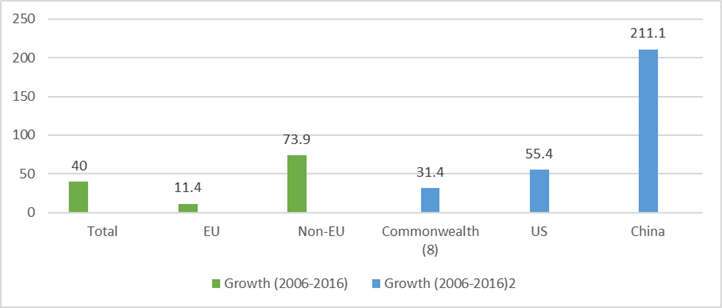
Chart 2b Trade (goods and services) balances, 2016 (£bn)

Source: ONS, UK Balance of Payments, the Pink Book, 2017 edition.
In conclusion, Commonwealth countries seem to have a bright economic future and offer expanding domestic markets that could greatly benefit UK exporters. There is, therefore, considerable potential for them to be future growth markets for UK exports.
This article gives the views of the author, and not the position of LSE Brexit, nor of the London School of Economics.
Ruth Lea CBE is Economic Adviser at the Arbuthnot Banking Group.
References
- GDP (PPP) data allow for the relative prices of goods and services, particularly non-tradeables, within an economy. They are, therefore, a better overall measure of the comparative real value of output than data calculated using market exchange rates (MERs).
- GDP data at market exchange rates (MERs) provide a better measure of a country’s international purchasing power, so relevant for international trade. Exchange rates can fluctuate wildly and currencies can, for example, be “overvalued” or “undervalued” for considerable periods of time.
- Sarianna Lundan and Geoffrey Jones, “The ‘Commonwealth Effect’ and the process of internationalisation”, World Economy, January 2001.
- EY, “Hitting the sweet spot: the growth of the middle class in emerging markets”, 2013.
- Exports to the top eight Commonwealth countries: Australia, Canada, India, Malaysia, New Zealand, Pakistan, Singapore and South Africa.


This seems to be a good analysis of the relevant trading data.
However, it seems to ignore non-economic factors. There is the obvious environmental factor of long ship journeys from foreign parts pouring further carbon dioxide into the atmosphere. Goods from outside the EU will not be produced to the EU’s high technical standards.
Above all, there is as ever the problem of immigration. This is highlighted by this week’s Windrush crisis. India for example has made it clear that any new trade agreement would depend on more UK visas for Indian citizens. Other Commonwealth countries (e.g. South Africa, Canada, Nigeria, the Caribbean, Malaysia, Australia) might make similar demands.
There would be fewer problems I suspect for more visas for members of the “White Commonwealth”. However visas for members of the “Black Commonwealth” would encounter the same problems there have been over EU immigration.
“Goods from outside the EU will not be produced to the EU’s high technical standards.”
Ahem. Remind me, which was the company that was involved in the biggest scandal over diesel emissions worldwide in the past few years? Was it VOLKSWAGEN, a GERMAN COMPANY IN THE EU that chose to game emission targets?
“There is the obvious environmental factor of long ship journeys from foreign parts pouring further carbon dioxide into the atmosphere.”
Shipping arguably is one of the lowest and most environmentally-friendly way of transporting large quantities of goods for long distances between countries that aren’t linked on land. And there’s already plenty of such environmental factor contributions existing now given that we have globalisation and the wholesale outsourcing of production and manufacturing to the Far East. The extra that might come from increased Commonwealth trade would be a drop in the ocean in comparison to that.
As to the issue of Commonwealth immigration, I choose to see it as the UK being constrained to undertake discriminatory immigration control regimes against non-EU and Commonwealth Citizens in order to have some semblance on immigration control, because they can’t go after EU citizens in the first place. Not a single EU country has managed to deport EU immigrants within their borders who are not eligible to settle down long-term in those countries (example: they don’t have a stable job, or home to stay in after 3 months). Commonwealth Citizens are paying the price for immigration favouritism practiced towards EU citizens, many of whom do not even share a common language (English) with British subjects unlike many from Commonwealth Countries. As to your assertion that there are fewer problems for “White Commonwealth” Citizens to obtain visas to stay in the UK, that is conjecture on your part with absolutely no concrete proof in it.
What I find quite remarkable about the Commonwealth argument is that it’s exactly the argument the UK initially made in the early days of European integration. Knowing that other European states cooperating closely would put the UK at a disadvantage, the government tried to use the Commonwealth as an alternative sphere of influence. This completely failed and we ended up having to join up to the integration project in any case.
Yet here we are, decades later and with almost the entirety of Europe now far more closely aligned than they were in the 1950s/60s, and we’re still making the argument that somehow we can use the Commonwealth as an alternative to avoid our influence/economic clout diminishing. And for what reason are we doing this? Simply to justify Brexit, not because it’s actually a good alternative on practical grounds.
Why is it not a good alternative? Well for a start, simply pointing at the size of a potential market says nothing about how you can gain unfettered trading access within that market. We have more or less complete free trade in the EU as members of the single market: no tariffs, shared regulatory frameworks, a shared system for ensuring compliance by all members. There is nothing remotely comparable to that available from Commonwealth countries. To create such a thing would require creating parallel international institutions and convincing the rest of the Commonwealth to join up, despite the fact that for many of these countries framing their entire trade policy around the interests of the UK makes little to no economic sense.
Creating something in the Commonwealth that gives even a fraction of the free trade we currently enjoy with European states would take a diplomatic genius several decades even under the best of circumstances. What’s feasible in the short-term would be some kind of small scale free trade agreement that differs in marginal sectors from what we could already have through the EU. Take Canada as an example: the country already has a free trade agreement negotiated with the EU, we’re actually withdrawing from that agreement via Brexit and then trying to negotiate something better (which Canada is unlikely to give us due to our smaller market and the fact it would undermine the agreement they already have with the EU if they suddenly gave us better terms).
Putting barriers between ourselves and the EU and trying to use closer relations with the Commonwealth to compensate is a strategy that it’s almost impossible to justify on practical grounds, particularly when you could simply try to pursue closer relations with the Commonwealth through the EU in any case (as has already happened with Canada) and save ourselves all of these costs in the first place.
You speak as though the EU is a single country. The member countries vary in their feelings towards the UK.
Certainly our voice carries no weight in deciding what laws and conditions apply to the UK.
Canada has already entered in a provisional trade agreement. It’s not us that’s putting barriers up but the EU. It has the most protectionist trade system in the world.
Why should any country surrender control of its laws, immigration, what conditions and who it can trade under when those countries are outside the EU, what tariffs must be applied to our imports, not be allowed to apply stricter animalhealthcare, not be allowed to police our own fishing grounds. All this just to trade with the rest of the EU who are desperate to trade with the UK. No other country in the would would accept any of these conditions just to trade.
If you’ll forgive me, I have to say a lot of what you’ve written here is quite reactionary and has only faint relevance to the points I raised above. For instance, you’ve said I “speak as though the EU is a single country” but I’m not really sure what that has to do with our topic. The EU is a group of states with shared rules governing trade. Whether they have different views about the UK or not is fairly irrelevant to what we’re discussing. As long as they’re part of a customs union we’re going to be dealing with them as a single entity when it comes to trade negotiations. That’s how the system works.
Second, you’ve said “no other country in the world would accept any of these conditions (meaning the conditions of EU membership) just to trade (with the EU)”. There are 27 other members of the EU and several other states (Norway, Iceland, Switzerland, Liechtenstein) that do accept said conditions or variants thereof, as well as a group of other states eager to do so if they can meet the EU’s criteria to join. Again, a fairly odd point to raise in this context.
Other statements are clearly just wrong: e.g. the EU having “the most protectionist trade system in the world” (it has a weighted average tariff rate that’s almost identical to the United States, lower than most developed nations, and nowhere near numerous countries like Brazil, India and others that are actually protectionist) or “our voice carries no weight in deciding what laws and conditions apply to the UK” (when we were one of the three most influential states in the EU, we had an absolute veto over the treaty process like every other state, and so on). I mean, I get people don’t like the EU, but you may as well be saying they want to ban Christmas for all the relevance this kind of thing has to reality. And again, my apologies for being blunt, but it’s difficult to see how else I could have responded to this.
With respect, you are not alone in totally missing the point. Ruth Lea is not trying to justify Brexit on economic terms alone. There is one reason that unites all brexiteers and that it Sovereignty. You can add Democracy to that too now, after the parliamentary and media driven shinnanagens of the past two years.