
 A common interpretation of Brexit maintains that there was a clear divide between more affluent and less well-off citizens when it came to supporting EU membership. Is this backed up by the available evidence? Mathias Koenig-Archibugi and Miriam Sorace (LSE) present a new way of looking at the question.
A popular narrative of Brexit pits “working-class Leavers” against “middle-class Remainers.” The idea that support for EU membership is associated with elitism and economic privilege has become a powerful frame employed by national-populist movements and the media that endorse them.

Critics of Brexit sometimes try to counter this frame by asking: “How can 48% be an elite?” But their argument is complicated by public opinion research that detects some differences in economic background between people who voted to leave the EU in the 2016 referendum and people who voted to remain. For instance, Matthew Goodwin and Oliver Heath found that “there is a strong relationship between household income and support for Leave… In households with incomes of less than £20,000 per year the average support for leave was 58% but in households with incomes over £60,000 per year support for leaving the EU was only 35%.” A NatCen report reaches a similar conclusion on the basis of a different survey: it shows that 66% of those with an income of less than £1,200 per month voted Leave, against 38% of those with an income of £3,701 or more. Such findings seem to point at a kernel of truth in the “elitism” narrative.
The causal relationship between income and views on EU membership is the subject of an important debate among scholars (e.g. here). For instance, Sara Hobolt has shown that the role of income in the vote to Leave the EU is small when other factors (age, education, social values, party identification) are taken into account. Here we do not aim to provide an exact estimate of the effect of income relative to alternative explanations of the Brexit vote. But we want to sound a note of caution with regard to how findings of a relationship between income and EU membership are presented and interpreted. Consider the following two graphs.
In Figure 1, based on data from the British Election Survey, we divided people within different household income brackets into those who voted to remain in the EU, on the left, and those who voted to leave the EU, on the right. Note that we don’t “equivalise” household income, i.e. we attribute the total household income to the survey respondent irrespective of how many other household members (if any) that income is shared with.
Figure 1. Household income distribution by vote in the 2016 referendum on EU membership
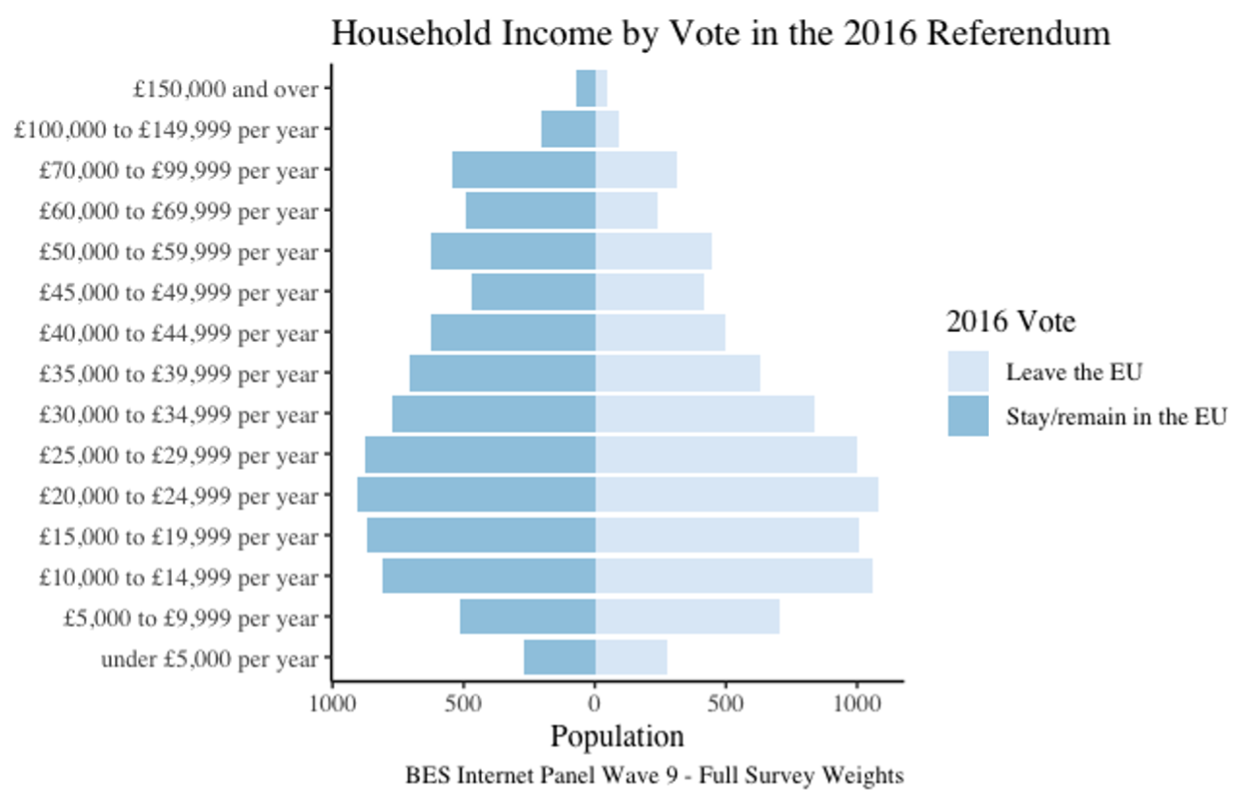
Figure 1 shows the pattern highlighted by other analysts: people in households with incomes over £50,000 were substantially more likely to vote for Remain, and the opposite can be observed in people whose households are at the other end of the income distribution, especially those around £10,000. But it is important to note that the vast majority of British voters are in households that fall between these levels. If we focus our attention on the income brackets where most voters can actually be found, the difference between the Remain and Leave vote is much less evident. From the perspective of their household income, the bulk of Remain voters looks remarkably similar to the bulk of Leave voters. We don’t see a clear divide between better-off and less well-off citizens in this regard.
Households are important economic units. But considering exclusively household incomes hides important aspects. Especially in single-income households, control over economic resources is often unevenly shared among household members. This control may be especially low for younger adults who are economically dependent on their parents, but not only for them. To take into account effective control over economic resources, we should consider also the distribution of personal income among voters and determine how that relates to support and opposition to Brexit. In Figure 2, we divided people within different personal income brackets into those who voted to remain in the EU (on the left) and those who voted to leave the EU (on the right).
Figure 2. Personal income distribution by vote in the 2016 referendum on EU membership
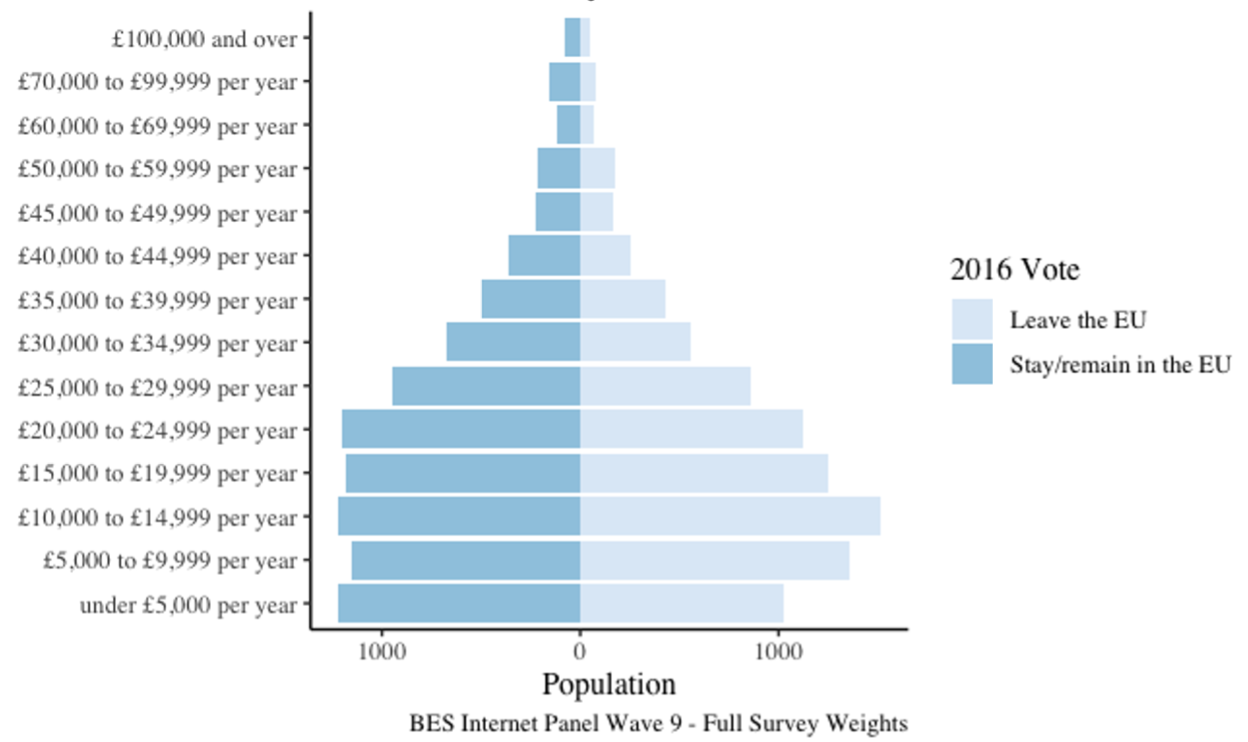
The income distribution on the left side of the graph is not identical to the distribution on the right side. In particular, the graph confirms that Remain is stronger than Leave among high earners. The populist narrative tends to attract the attention on this difference. While the difference is real, it should be seen in the context of the whole distribution. Overall, what is most striking about the graph is how similar the left and right distributions become when we take into account economic dependence within households. In terms of their personal income, the vast majority of Remain voters are barely distinguishable from the vast majority of Leave voters. This is something that the typical ways of presenting research findings tends to obscure, but our graph can reveal.
We know that the British people are as divided as ever over Brexit and that Leave and Remain now form an important part of their political identities. But framing the division as mainly a tug of war between richer and poorer citizens is a distortion of reality that lowers the quality of public debate on a critical issue for the country and for Europe.
Technical note
The data is from the internet panel of the British Election Study – wave 9 – fielded at the end of June 2016. A caveat is that self-reported income is often a sensitive question and is prone to missing data, which affects all studies cited in this blog entry. 38% (111,421) of all BES respondents did not answer the household income question. To check for asymmetries in reporting one’s income by vote in the Brexit referendum, we checked for non-response by Leave-Remain vote. 36% (5118 respondents) of those that voted Remain did not declare their household income in the survey, while 39% (5436) of Leave respondents did not declare it in this survey. Overall the difference in non-response is not that striking. Similarly, 36% (10,819) of all BES respondents did not answer the personal income question. 34% (4740 respondents) of those that voted Remain did not declare their income in the survey, while 38% (5264) of Leave respondents did not declare it in this survey. Again, the difference in non-response is quite low. Another caveat is that 6.5% of respondents to the BES did not declare what they voted in the 2016 referendum. The descriptive distribution built in the graph above has used survey weights to ensure the sample is representive.
This post represents the views of the authors and not those of the Brexit blog, nor the LSE.
Mathias Koenig-Archibugi is Associate Professor (Reader) of Global Politics in the Departments of Government and International Relations, LSE.
Miriam Sorace is LSE Fellow in EU Politics.


Income is synonymous with education. What the research also reveals, though you’re too polite to say it, is that the less education you have, the more likely you are to vote Brexit. Go figure.