
On 1 May this year, while observing Labour Day celebrations, Kenya’s President, Uhuru Kenyatta, announced an 18 per cent hike in the minimum wage, the country’s most ambitious raise in just about a decade and one that scaled up the minimum wage to Kes 20,296 – about US$ 196.8. (Computation based on the gazetted minimum wage for Nairobi, Mombasa and Kisumu as indicated by the Kenya National Economic Survey 2016)
The move came against the backdrop of a resurgence of a clamour for raises in the minimum wage in select markets across Africa, with South Africa set to introduce a 3,500 Rand (about $ 260.0) per month minimum wage in 2018. In the meantime, headlines abound of an impending hike in Nigeria from the present 18,000 Naira (about $ 56.9).
This bodes a welcome shift in policy focus to wage/income inequality as a key issue facing economies in the continent, especially at a time when a general economic downturn and relatively high inflation have eroded households’ purchasing power. In April 2017, inflation stood at 17.3 per cent in Nigeria and 11.5 per cent in Kenya.
In South Africa and Nigeria, for instance, income inequality has widened over the last two decades, as shown by the Gini coefficient, an indicator of the divide between the haves and the have-nots, which measures income inequality within the scale 1 – 100, with inequality rising as one approaches 100. For South Africa, the Gini coefficient rose from 57.8 to 63.4 between 2000 and 2012, and for Nigeria it went from 40.1 to 48.8 between 2003 and 2010. (Data from the United Nations’ World Income Inequality Database)
This presents an opportune moment to interrogate the state of wages in Africa, with the first issue being whether adjustment in the statutory minimum wage has had real gains for low-income households. One way to assess this is to determine whether hikes in the minimum wage have been large enough to present a buffer against the inflationary corrosion of incomes.
Due to the unavailability of historical data, consider 2003 as the base year with Kenya’s minimum wage set at Kes 6,142 and the Consumer Price Index (CPI) at 51.5 (Business Monitor International). In light of this, the May 2017 hike takes the minimum wage to the closest it has been to the inflation-beating threshold, a level that ensures persons in this income bracket have purchasing power equal to their counterparts in 2003 (the base year), since 2004.
Figure 1. Kenya’s statutory minimum wage vs. the inflation-beating minimum wage (in Kenyan shillings)
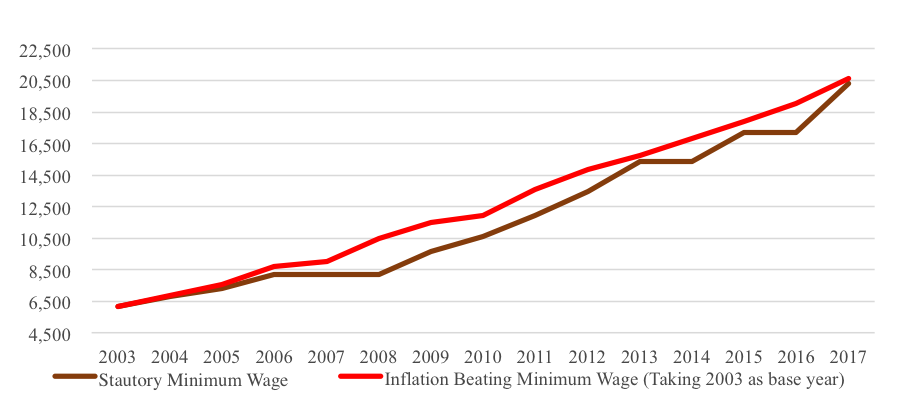
Note: 2017 CPI based on Business Monitor International forecast. Source: International Labour Organization, Kenya National Bureau of Statistics.
The latest hike ought to be lauded to the degree that it reflects policy goodwill, taking steps towards the realization of one of the core objectives of a statutory minimum wage – to serve as a tool that helps overcome poverty and reduce inequality (International Labour Organization, 2016). The significance of this development is better appreciated when we see that it comes at a time when Sub-Saharan African countries are hard pressed for counter-cyclical measures to arrest a general economic downturn.
The riddle of stagnant wages amidst rapid economic growth
More importantly, however, what does the rate of growth in the average wage in the economy tell us? Kenya’s case is of particular interest. Despite posting relatively robust economic expansion over the last decade, wages have not only failed to keep up with the economy’s momentum but have been, by and large, muted and indicative of the likelihood that the economy is grappling with the reality of a stagnant-wages trap. Whereas between 2003 and 2015 the global economy grew by an average 2.9 per cent compared to Kenya’s 5.1 per cent, the world’s wage growth averaged 2.1 per cent, dwarfing Kenya’s 0.1% as shown in the bubble chart below.
The implication here is that Kenya’s economic tide has been anything but even, with its crest lifting only a few boats whilst the vast majority are submerged in the trough beneath, excluded from the dividends of accelerated growth. This could help put into perspective the wave of strikes that has befallen the country in the recent past. As shown below, the trend has been different for peer frontier and emerging markets across the world for the same period with GDP growth, on average, being 169 basis points, against Kenya’s 500 basis points, above growth in wages.
Figure 2. Real GDP growth vs. growth in average wage (2003-2015)
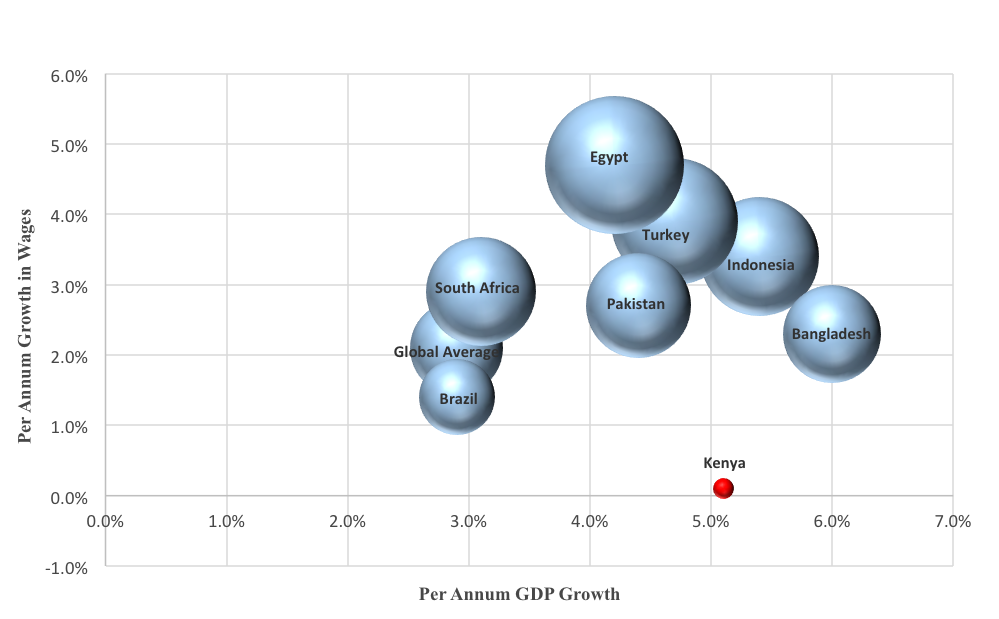
Note: Size of bubble denotes the rate of growth of wages. Source: International Labour Organization, World Development Indicators.
Whilst the crisis of stagnant wages has received extensive focus in advanced economies, notably in the face of sluggish post-Great Recession recovery, there has been considerably less focus on the same in frontier markets in general, and Sub-Saharan Africa in particular. Economic theory suggests a number of factors could explain stagnation in wages including, but not limited to, inadequate policy focus on realization of full employment, and slow growth in labour productivity. In their 2016 publication titled The Road to Full Employment – What the journey looks like and how to make progress, Paul Gregg and Laura Gardiner argue that full employment is the surest route to delivering progressive gains in living standards. If such is the case, how do the countries under consideration compare when their pace of reduction in unemployment and growth in labour productivity are plotted? The results are mixed.
Figure 3. Decline in overall unemployment vs. growth in labour productivity

Note: Size of bubble denotes growth in labour productivity. Source: International Labour Organization.
The following observations are worthy of mention:
Indonesia, which posted well above average growth in wages, equally stands well above average in both reduction of the overall rate of unemployment and growth in labour productivity. Kenya, which posted the lowest growth in wages also posts amongst the lowest rate of reduction in the unemployment rate as well as relatively low growth in labour productivity.
Distinct outliers are Egypt and Pakistan. In the case of Egypt, the country posted the highest growth in wages but also stands out as the only country in which the overall rate of unemployment has risen in the period under review. This notwithstanding, the fact that unemployment was on a general downtrend between 2003 and 2010 and also rose rapidly between 2011 and 2013 suggests this could have a lot to do with the socio-political upheaval that embroiled the country.
Perhaps a piece that could help resolve the puzzle lies in assessing the structure of employment by sectors.
Figure 4. Percentage of labour in agriculture vs. services and industry (2003)
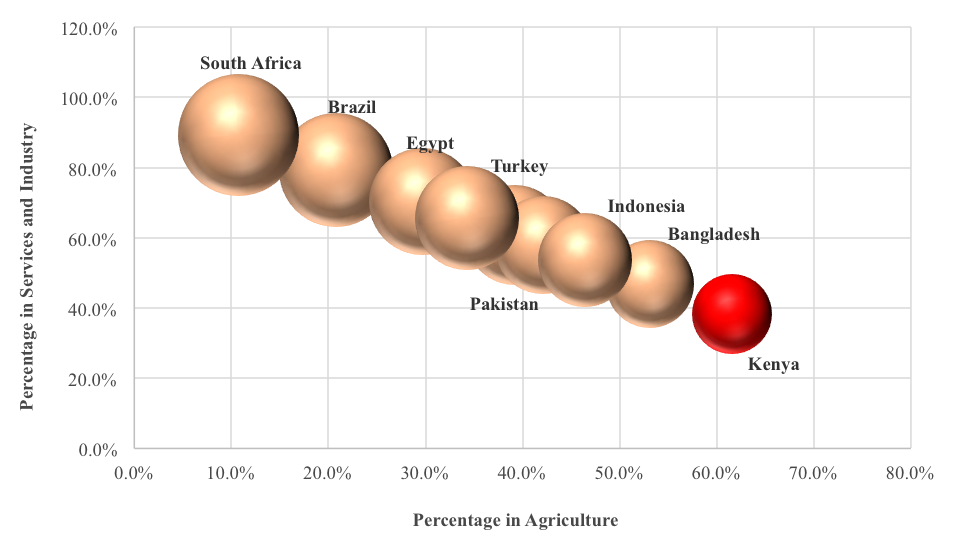
Note: Size of bubble denotes proportion of labour force in services and industry. Source: International Labour Organization.
Figure 5. Percentage of labour in agriculture vs. services and industry (2015)
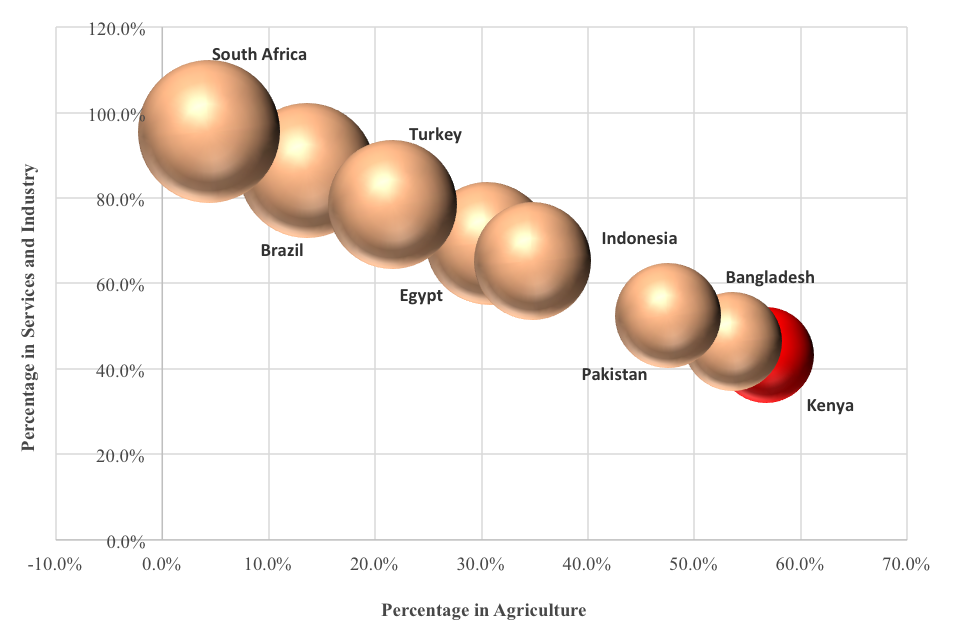
Note: Size of bubble denotes proportion of labour force in services and industry. Source: International Labour Organization.
The way forward: The vital transition
Of all the economies under consideration, Kenya is the only one that has more than half of its labour force employed in the agriculture sector – 56.7 per cent as of 2015 according to the International Labour Organisation. Between 2003 and 2015, the global average of the percentage of labour force in agriculture declined by 890 basis points with significant declines being report in Turkey, Indonesia, Brazil and South Africa, as shown in the table below. Kenya has, however, been comparatively slow in transitioning the bulk of its labour force from agriculture to services and industry and this could be a key factor underlying muted growth in wages.
Table 1. Reduction in % of labour force in agriculture between 2003 and 2015 (basis points)
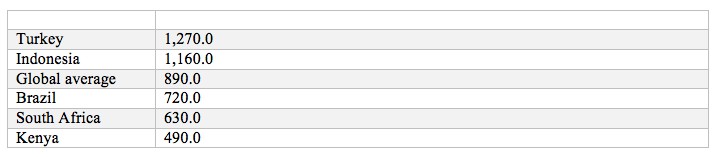
Source: International Labour Organisation
The data from Brazil, Turkey and South Africa shows that, generally, earnings in the agriculture sector are lower than those in other sectors of the economy and this explains the need for economies to have the bulk of the labour force transition to the high value added industrial and services sectors over time.
Figure 6. South Africa’s average monthly earnings, Rand (2011-2013)
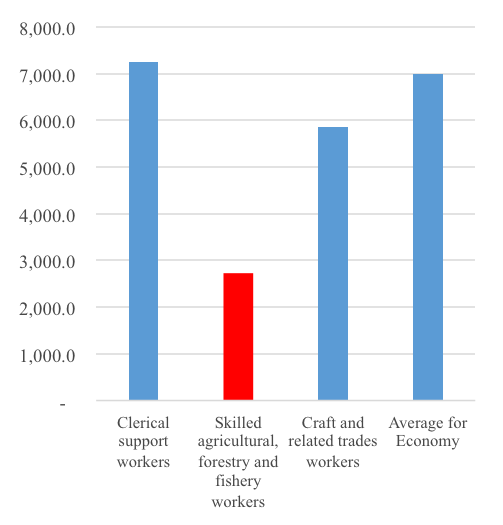
Source: International Labour Organisation
Figure 7. Brazil’s average monthly earnings, Real (2012-2016)
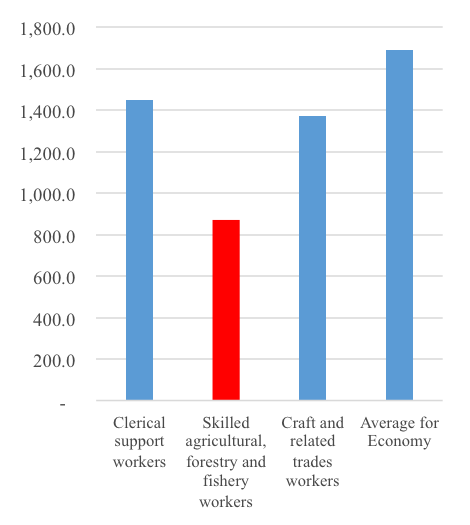
Source: International Labour Organisation
Over the last decade, rapid economic growth in a number of Sub-Saharan Africa economies has captured the world’s imagination. The reality of stagnant wages, however, blows the lid off the growth hype, exposes underlying fault lines and begs urgent rethink of policy focus in some economies. Stunted growth in wages is not unique to Kenya, with available data showing that Botswana posted an average 0.1 per cent growth between 2003 and 2013, while in Uganda there was an average contraction of 0.9 per cent between 2005 and 2013. Addressing this situation is poised to be one of the next decade’s key issues for Sub-Saharan Africa.
♣♣♣
Notes:
- The post gives the views of its author, not the position of LSE Business Review or the London School of Economics.
- Featured image credit: Nairobi, by Sarah Owermohle, under a CC-BY-2.0 licence
- Before commenting, please read our Comment Policy.
 Julians Amboko is a Senior Research Analyst with StratLink Africa Ltd, a Nairobi-based financial advisory firm focusing on emerging and frontier markets. He covers macroeconomic research and analysis for Sub-Saharan Africa, including markets such as Nigeria, Kenya, Ethiopia, Ghana, and Angola. He tweets at @AmbokoJH


Traditionally economies have always grown through structural change and gains in labor productivity, In Africa structural change has been rather muted as economies have largely been dependent on informal sectors to create most of the employment. Its also notable that manufacturing sector contribution to GDP has been stagnant since the 1970s.