
The increase in U.S. income inequality since 1970 largely reflects gains made by households in the top 20 per cent of the income distribution. Estimates suggest that households outside this group have suffered significant losses from foregone consumption, measured relative to a scenario that holds inequality constant. A substantial mitigating factor for the losses has been the dramatic rise in government redistributive transfers, which have doubled as a share of U.S. output over the same period
Income inequality in the United States has increased dramatically in recent decades. Most of the increase can be traced to gains going to those near the top of the income distribution. As emphasised by Piketty (2014, p. 297), from 1977 to 2007 three-fourths of the income growth in the U.S. economy went to the top 10 per cent of households.
The rise in U.S. income inequality
Figure 1 shows the dramatic climb in the share of before-tax income (excluding capital gains) going to the top 10 per cent of U.S. households ranked by income. Their share increased from 32 per cent in 1970 to 47 per cent in 2014. The corresponding income share for the top 20 per cent of households rose from 43 per cent in 1970 to 51 per cent in 2014. The faster rise of the top 10 per cent share reflects the disproportionate gains of the highest earners.
Figure 1. U.S. before-tax income shares
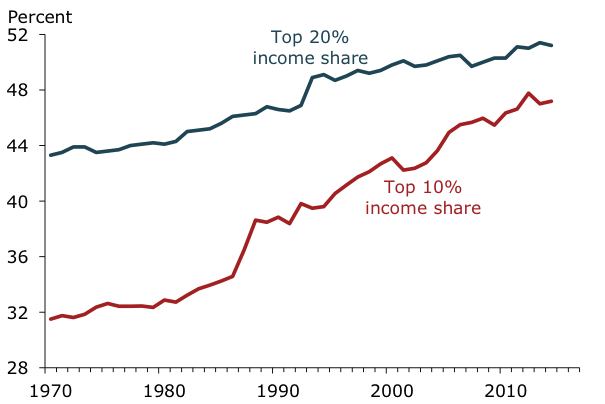
Source: Census Bureau (Table H-2), World Top Incomes database (www.wid.world).
Another way to track income is by source. Labour income includes wages and other types of employee compensation. Capital income includes corporate profits, rental income, and net interest income. Figure 2 shows that the share of total income from capital sources increased from 35 per cent in 1970 to 43 per cent in 2014. During this period, the top 20 per cent of households ranked by income owned more than 90 per cent of total financial wealth.
Given this highly skewed wealth distribution, the increase in capital’s share of income would be expected to disproportionately benefit households in the top 20 per cent of the income distribution. But as a mitigating factor, Figure 2 also shows that government transfer payments to individuals approximately doubled, rising from about 7 per cent of GDP in 1970 to nearly 15 per cent in 2014. These transfer payments primarily redistribute income through various social programs, including disability and unemployment insurance, Medicare and Medicaid, and food stamps. As such, these transfers should disproportionately benefit households in the bottom 80 per cent of the income distribution.
Figure 2. Capital’s share of income and government transfers
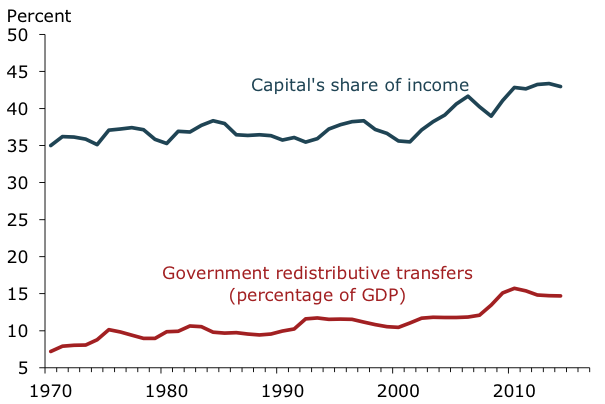
Note: Capital’s share of income is measured as 1 minus the ratio of employee compensation to gross value-added of the corporate business sector. Source: Bureau of Economic Anlaysis (NIPA Table 1.14), FRB St. Louis FRED database.
Modeling strategy
In a recent article, we use a quantitative economic model to gauge the consumption gains or losses that result from this pattern of rising U.S. income inequality. We compare consumption in the actual scenario with rising inequality and transfers to consumption in a hypothetical alternative scenario in which inequality and transfers do not increase. Specifically, the alternative scenario holds household income shares and government transfers relative to output at their 1970 levels. The results indicate that the increase in income inequality since 1970 has delivered large consumption gains to households in the top 20 per cent of the income distribution. But for households outside this exclusive group, the consumption losses relative to the alternative scenario appear to have been significant, albeit substantially mitigated by the large increase in government redistributive transfers since 1970.
Analysing other scenarios shows that a relatively modest boost in the historical growth rate of redistributive transfers, accompanied by modestly higher average tax rates, could have achieved small but equal consumption gains for households throughout the income distribution
Our model allows us to split aggregate U.S. consumption expenditures into the implied consumption paths for two groups: (1) households in the top 20 per cent of the income distribution, and (2) households in the bottom 80 per cent of the distribution. We compute the consumption gain or loss by comparing each group’s consumption path to a hypothetical alternative scenario that holds income shares and redistributive transfers at their 1970 levels. For households in the top income group, our results indicate that the increase in income inequality has delivered a gain that is equivalent to a 3 per cent increase in annual consumption every year in perpetuity. By contrast, each household outside the top income group has suffered a loss that is equivalent to a 1 per cent drop in annual consumption every year in perpetuity.
Importance of redistributive transfers
If the ratio of transfers to output were held at the 1970 level but income inequality continued to rise as before, then the consumption loss for each household outside the top income group would be magnified by a factor of nine. In other words, each household in this group would now suffer a loss that is equivalent to a 9 per cent drop in annual consumption every year in perpetuity. This result shows that the historical pattern of rising U.S. transfer payments has done much to mitigate the negative impacts of rising income inequality for households outside the top income group.
We also use the model to determine how transfers would have needed to grow to deliver equal gains to both groups of households. We find that the ratio of transfers to output would have needed to increase faster, reaching 19 per cent by 2014 versus the actual value of 15 per cent in the data. In this case, the consumption gain for both groups turns out to be quite small. This is due to the need for higher tax rates to finance the faster transfer growth. But these higher tax rates would still be near the low end of the range of average tax rates among OECD countries. Moreover, while the resulting gains may be small, the scenario still represents a significant improvement (relative to what actually happened) for households outside the top income group.
Conclusion
The increase in U.S. income inequality over the past half-century can be traced to gains made by those near the top of the income distribution—where financial wealth and corporate stock ownership is highly concentrated. The economic and political implications of this pattern of rising inequality have garnered substantial attention among researchers and policymakers. Overall, our results suggest that there is room for policy actions that could offset the negative consequences of rising income inequality.
♣♣♣
Notes:
- This blog post is based on the authors’ paper Top Incomes, Rising Inequality, and Welfare. Economic Journal, vol. 128, pp. 262-297 (2018).
- The post gives the views of its authors, not the position of LSE Business Review or the London School of Economics.
- Featured image credit: Photo by Paul Stein, under a CC-BY-SA-2.0 licence
- When you leave a comment, you’re agreeing to our Comment Policy
 Kevin J. Lansing is a research advisor in the Economic Research Department of the Federal Reserve Bank of San Francisco.
 Agnieszka Markiewicz is an assistant professor at Erasmus University, Rotterdam.