 For the first time since the 1960’s, the entire of the UK will vote in an election other than a referendum or General Election, with Scotland, London, Wales, and Northern Ireland going to the polls. Here, Kenneth Bunker, from the Democratic Dashboard team, examines recent results in Northern Ireland, Scotland and Wales and looks ahead to the elections in May.
On May 5, 2016 the devolved legislatures of Northern Ireland, Scotland, and Wales will hold elections to renovate the totality of their seats. It will be the fifth election of the Northern Ireland Assembly, the Scottish Parliament, and the Welsh Assembly. In this article I summarise the major aspects of their respective electoral systems and party systems. I show results for the major parties in recent elections, focusing on the distribution of votes and seats. I conclude by highlighting some basic electoral junctures given recent and historical trends.
Northern Ireland
There have been 4 elections since the devolution of the Northern Ireland Assembly: in 1998, 2003, 2007, and 2011. In each election a total of 108 seats are contested. The electoral system is the Single Transferable Vote (STV) system of proportional representation. Voters can indicate their preference for one or more candidates. They have as many preferences as there are candidates.
There are 18 constituencies, and each constituency elects 6 members. Elected candidates are known as Members of the Legislative Assembly (MLAs). Only four parties have been able to secure more than 5% of the seats in each of the previous four elections: the Democratic Unionist Party (DUP), Sinn Féin (SF), the Ulster Unionist Party (UUP), the Social Democratic and Labour Party (SDLP), and the Alliance Party of Northern Ireland (APNI). All other parties have failed to pass this threshold.
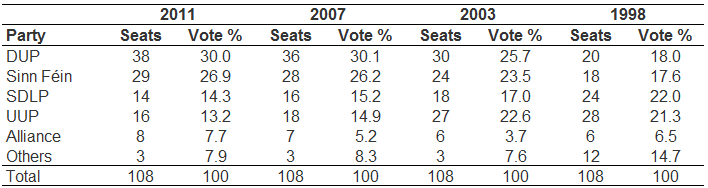
Table 1 shows how party preferences have evolved in Northern Ireland since the first election. In 1998, the SDLP was the party with most votes in the Assembly, while the UUP was the party with most seats. In the 2003 election, the DUP took the most votes and seats, and Sinn Féin moved from being the fourth largest party, to the second largest party. In 2007 this trend consolidated, when the sum of votes for the DUP and SF reached 56%. By 2011, the DUP and SF were the undisputed largest parties in the system, leaving the SDLP, the UUP, and the Alliance significantly behind.
Table 1: Changes in Party Preferences
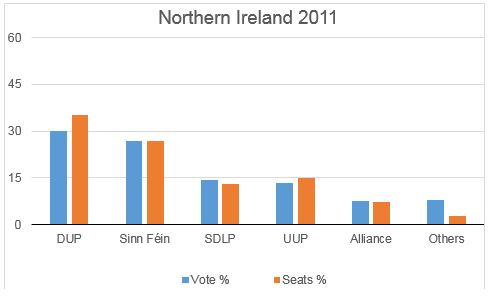
Northern Ireland’s electoral system tends to favour the largest parties. Since the first election, in 1998, the larger parties have been overcompensated in detriment of the smaller parties. Figure 1 shows that in the 2011 election the DUP obtained 45% of the votes, but was assigned 54% of the seats in the Assembly. The most affected parties were the smaller ones, which obtained 6.5% of the votes, but only 2.3% of the seats.
Figure 1: Votes and Seats
Scotland
There have been 4 elections since the devolution of the Scottish Parliament: in 1999, 2003, 2007, and 2011. In each election a total of 129 seats are contested. The electoral system is the Additional Members System (AMS), in which each voter has two votes. The first vote can be used to vote in a plurality election, and the second vote can be used to vote in a regional election.
There are 73 constituencies, grouped into 8 regions. Each constituency elects one member by the plurality first past the post (FPTP) system of election. Simultaneously, each region elects seven additional members from a closed list. The elected candidates are known as Members of Scottish Parliament (MSPs).
Only three parties have been able to secure more than 5% of the seats in each of the past four elections: the Scottish Labour Party (Lab), the Scottish National Party (SNP), and the Conservative Party (Con). Other than these parties, the Liberal Democrats (Lib Dems) were able to obtain more than 5% of seats in three elections (1999, 2003, and 2007), and the Scottish Green Party (SGP) was able to do so in one election (2003).
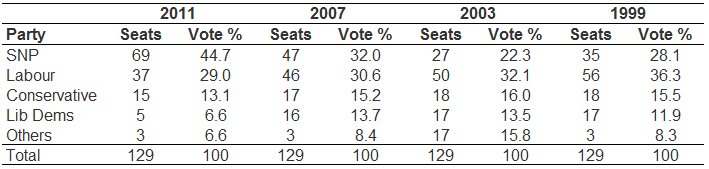
Table 2 shows how party preferences have evolved in Scotland since the first election. In 1999, Scottish Labour was the party with most votes and seats in Parliament. In the 2003 election, Labour marginally the pole position, as the largest party in the system. In 2007, SNP became the largest party in Scotland, after marginally overtaking Labour in votes and seats. By 2011, the SNP consolidated as the largest party in Parliament, leaving Labour by more than 15% of the votes and 20 seats. Over this same time frame, Conservatives fell from 18 seats to 15, and Liberal Democrats fell from 17 seats to 5.
Table 2: Changes in Party Preferences
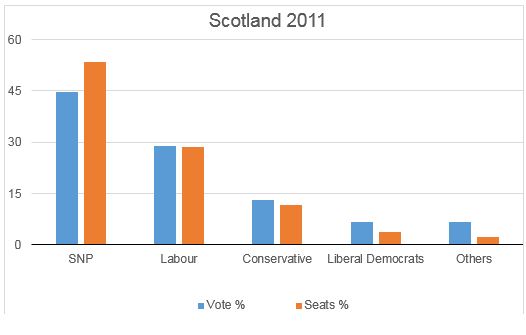
As in the case of Northern Ireland, the electoral system has tended to favour the largest party. Figure 2 shows the difference between the percentage of votes and the percentage of seats assigned to each of the largest parties in the 2011 election. It shows that the SNP was substantially favoured by almost 10%, since it received 45% of the votes and 54% of the seats. Labour came out even, and all other parties were harmed by the translation of votes into seats.
Figure 2: Votes and Seats
Wales
There have been 4 elections since the devolution of the Scottish Parliament: in 1999, 2003, 2007, and 2011. In each election a total of 60 seats are contested. The electoral system is the Additional Members System (AMS), in which each voter has two votes. The first vote can be used to vote for the plurality election, and the second vote can be used to vote in a regional election.
There are 40 constituencies, grouped into 5 regions. Each constituency elects one member by the plurality first past the post (FPTP) system of election. Simultaneously, each region elects four additional members from a closed list. The elected candidates are known as Assembly Members (AMs). Only four parties have been able to secure more than 5% of the seats in each of the past four elections: the Labour Party (Lab), the Conservative Party (Con), Plaid Cymru (PLA), and the Liberal Democrats (Lib Dems).
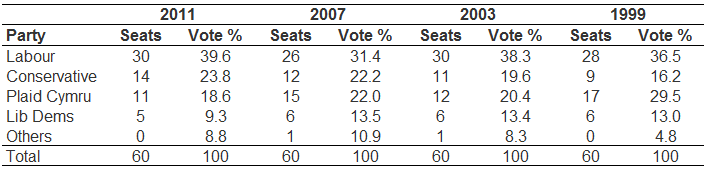
Table 3 shows how party preferences have evolved in Wales since the first election. In general, they have remained stable. The Labour Party has consistently been the largest party, followed by Plaid Cymru in the 1999 and 2003 elections, and by the Conservative Party in the 2007 and 2011 elections. While PLA fell from 30% of the vote in 1999 to 19% of the vote in 2011, the Conservatives rose from 16% of the vote in 1999 to 24% of the vote in 2011. Liberal Democrats obtained 13% of the votes in the first three elections, but fell to 9% in the last election.
Table 3: Changes in Party Preferences
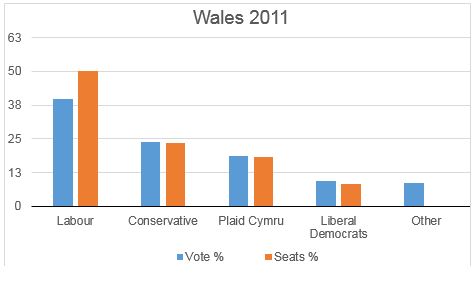
In the translation of votes into seats, the largest party is favoured. Figure 2 shows that in 2011 the Labour party obtained 40% of the votes but 50% of the seats. It was the only party to be overcompensated. All other parties obtained a larger percentage of votes than seats.
Figure 3: Votes and Seats
What’s in play?
The upcoming election will be the fifth since devolution. Each of the three countries face their own specific junctures. In the case of Northern Ireland, the question is whether Sinn Féin will finally be able to overtake the DUP as the largest party. In the case of Scotland, the question is whether the SNP will repeat their 2015 Westminster election victory, and conquer the districts where Labour and Conservatives still have close to half of the representatives. In the case of Wales, the question is whether Plaid Cymru will follow in the footsteps of the SNP and secure a nationalist victory.
Please read our comments policy before commenting.
Note: This article was originally posted at Democratic Dashboard. It gives the views of the author, and not the position of EUROPP – European Politics and Policy, nor of the London School of Economics.
Shortened URL for this post: http://bit.ly/1Wfm3k0
_________________________________
Kenneth Bunker – LSE
Kenneth Bunker is a Research Assistant at Democratic Audit at the London School of Economics. He holds a PhD from the Department of Government, London School of Economics and Political Science.