
 It is widely expected that the Conservatives will outspend their opponents in the election campaign, including the amounts spent on individual constituency contests. But which of their local parties are attracting most in donations? Analyses of recently-released data on donations for the whole of 2014 by Ron Johnston, Charles Pattie and David Cutts suggest that the Tories narrowed their focus to ensure that they retained control of the marginal seats they won in 2010 and attracted much less for their campaigns to win marginal seats held by the Liberal Democrats and Labour – a strategy that clearly contrasted with Labour’s goal of increasing its number of MPs.
The Electoral Commission’s recent publication of all substantial donations to the political parties during the final quarter of 2014 confirmed what most commentators believed: the Conservatives were raising much more money than their opponents. In the first three quarters of 2014, for example, their reported donations (in cash or kind) totalled £20.8million, with a further £8.4million in the final quarter. But where was the money going, and does any change in its direction over the year indicate alterations in the party’s strategy?
The Conservatives announced in 2012 that their local campaigning would focus on 80 constituencies – 40 lost in 2010 by the smallest margins and the comparable 40 won then. Holding on to the latter and winning the former should deliver an overall majority. During 2014, its constituency parties received donations totalling £3.8million, 35% of it during the final quarter. But only 13% went to local parties in the 40 marginal seats lost in 2010, and 19% to the 40 marginals won then; over two-thirds of all money donated went to local parties outside that central band of 80 marginal seats.
The first diagram shows the amounts donated to all 631 constituency parties in Great Britain (i.e. excluding Buckingham, held by the Speaker). The seats are grouped according to whether they were won or lost in 2010, in 5 percentage-point marginal bands. The first five categories – on the left – comprise seats lost (‘Hopeless’ – by over 20 percentage points – to ‘Winnable’ – lost by 5 points or less): the other five – on the right – are those won.
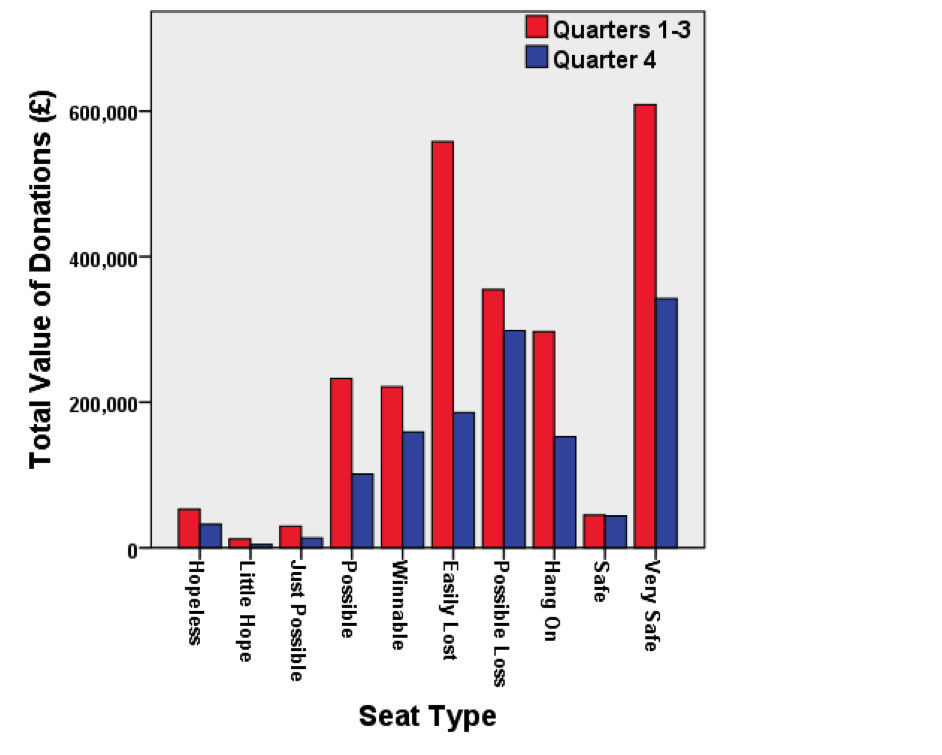
Of the seats lost in 2010, very little was donated to the first three categories, where victory in 2015 is very unlikely; about £400,000 each went to the other two categories – ‘Possible’ and ‘Winnable’ seats. Much more was donated to local parties in marginal seats won in 2010, although of the c.£600,000 received in the first three quarters to ‘Easily Lost’ constituency parties, £206,325 went to just one – Watford (with a further £31,735 in the final quarter): Watford is one of the few three-way marginal seats and the Liberal Democrats’ candidate is the popular local mayor. More surprising is that 25% of all money donated went to local parties in ‘Very Safe’ seats. This was as much as was raised in the marginal constituencies the party needed to win from Labour or the Liberal Democrats if it was to form a majority government in 2015. Donors seem happier to support candidates unlikely to lose than those seeking to overthrow an opponent!
Was there a change in strategy during 2014? There were media suggestions that the Conservatives decided to focus increasingly on defending the seats held – partly responding to UKIP’s threat, which could facilitate Labour victories there. In the first three quarters, 23% of the donations by value went to the ‘Easily Lost’ constituency parties and 15% to those in the ‘Possible Loss’ category. In the final quarter, the respective percentages were 14 and 22 – suggesting that the party might even have given up on some of its most losable seats and instead pressed donors to favour those won by majorities of 5-10 points. This shift is even more marked if we exclude the large donations to Watford: without them, in the first three quarters the ‘Easily Lost’ and ‘Possible Loss’ local parties each obtained 16% of all donated money; in the final quarter their respective shares were 12 and 23%.
In the marginal seats where the Tories lost in 2010 more money was donated to local parties where the Liberal Democrats won than in those held by Labour – given their coalition partner’s position in the polls, their seats were seen as better prospects than were those held by Labour. In the marginal seats being defended by the Tories, however, they raised more in donations where Labour came second in 2010 and were providing the main challenge in 2015 – there are few, if any, seats where Liberal Democrat candidates are a threat to Tory incumbents (Watford is an obvious exception!).
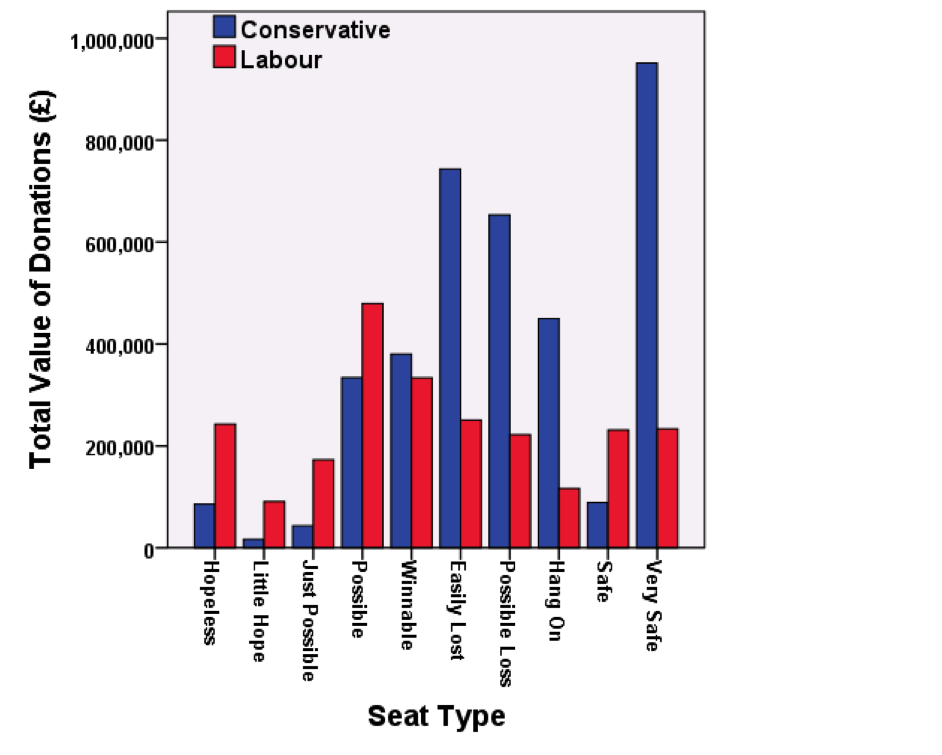
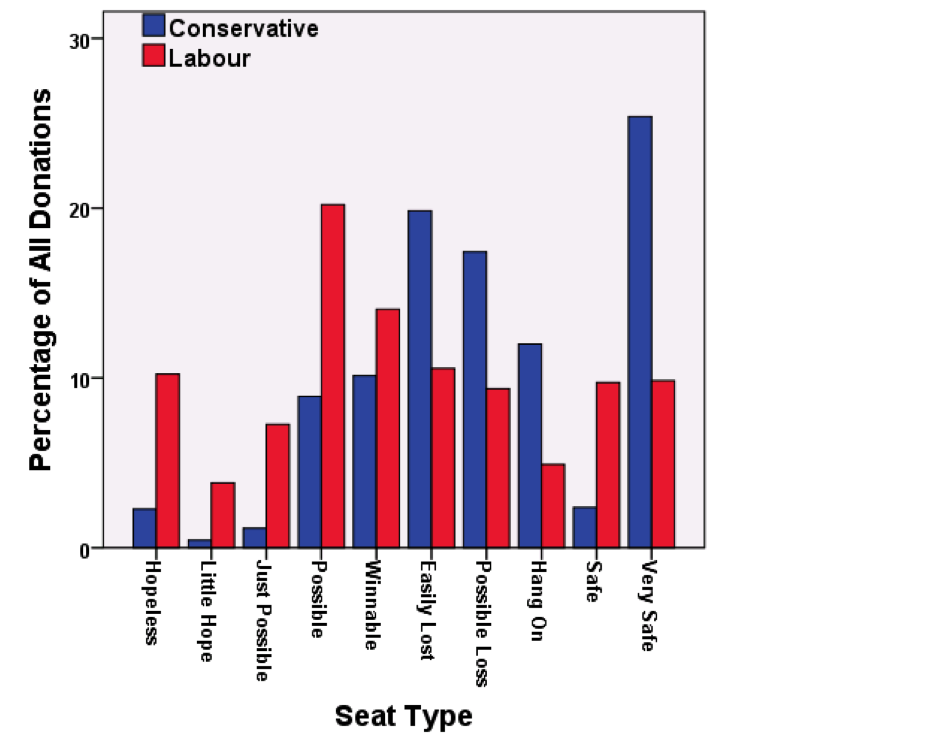
How does this pattern of Conservative money-raising through donations compare with the other parties’? The second graph compares money donated to Conservative and Labour local parties. The Conservatives raised much more – nearly £1million in their ‘Very Safe’ seats alone, compared to just over £200,000 for Labour in its ‘Very Safe’ seats. Labour’s money-raising was much more focused on seats where it lost in 2010. This is clarified by the third graph, which shows the distributions as percentages of the total money received by local parties during the year. Over half of the money donated to Labour local parties went to constituencies lost in 2010, compared to less than one-quarter of all Conservative donations going to their comparable seats; the Conservatives raised more than that for their ‘Very Safe’ seats.
Although the Liberal Democrats have a network of constituency parties across much of Britain, in London and some major urban centres they are organised by local authorities, each containing two or more seats. Including the latter, they received £2.3million in 2014: £1.4million went to individual constituency parties, £1million to 31 with incumbent MPs and a further £223,000 to 13 which would be considered reasonable targets in a ‘normal election’ – where the Liberal Democrats were less than 5 percentage points behind the 2010 victor. In addition, £935,500 was donated to 40 larger units, 12 of which included a seat with a Liberal Democrat incumbent (they received £641,978) and a further 11 included ‘target’ seats (which received £163,615). Of the total income from donations to local parties, 71% went towards defending seats: not surprisingly, Liberal Democrats were concentrating on hanging on to what they already held.
The Greens received £724,765 in 2014, of which £591,000 went to the central organisation and the remainder to regional or borough party units. Twenty-one UKIP constituency parties received £184,293; in addition, nine groups of two or more constituencies and eleven regional groupings received £32,650 and £164,296 respectively. The bulk of UKIP’s donations – £3,838,024 – went to the national party, however. The SNP received £4.1million during 2014, probably for the independence referendum campaign (almost all of the donations were received before the end of September): only six donations were to local parties. Finally only one Plaid Cymru constituency party received donations in 2014 – £124,585 to the Ynys Mon unit from the same individual: apart from its Short Money, the central party organisation received only £60,000.
In total, some £10million was donated to local parties in 2014. The Conservatives raised most, increasingly focused on the seats they were defending, including very substantial sums to local parties where defeat was extremely unlikely. Unless the pattern of donations was at odds with the party’s strategy (i.e. it was unable to solicit funds where it needed them most) this suggests that – like the Liberal Democrats – they decided to concentrate on retaining as many of their seats as possible rather than campaign hard to increase their complement of MPs. Labour, meanwhile, was more aggressive; it raised less money for local campaigns than the Conservatives, but more of it was being directed to seats lost in 2010 but where it hopes to win this time.
Money, of course, is a necessary component of all local campaigns – needed for leaflets, posters etc. – but large donations are not sufficient to ensure success (and, of course, candidates in safe seats need some to underpin their – perhaps lower-key – campaigns). Some donors may prefer to give money to support known incumbents than to help fund potential gains elsewhere – and it may be that Labour is better at suggesting where its major donors send their money: 51% of Conservative donations to local parties by value came from individuals compared to 31% for Labour, whose local parties got 26% of their money in 2014 from trades unions. Some – many? – local parties may be unable to attract money in large donations but can finance their campaigns through smaller sums plus other fund-raising activities, and where there are shortfalls in the amount available locally these may be compensated by campaigning organised and funded from national and regional offices.
Nevertheless, the pattern of large donations to constituencies in 2014 provides some intriguing insights to the parties’ campaigning strategies: have the Tories really pulled back from a hard push to win 40 more seats – or is the money rolling in now to sustain a last minute push there?
Ron Johnston is Professor of Geography at the University of Bristol.

Charles Pattie is Professor of Geography at the University of Sheffield, specialising in electoral geography.
David Cutts is a Reader in Political Science at the University of Bath.


It’s not clear from the article whether the graphs show funds raised by constituency or funds given from a central pot to each constituency. If it’s the former, it’s an Interesting angle on the figures but an odd one to choose. It seems to be conflating the motivation of the donor with the need of the donee. An alternative interpretation would be that in strong Tory areas supporters are willing to donate. In strong Labour areas there is less ability to donate or more apathy. In more marginal seats Labour are attracting more funds – maybe because there are more funds to be won or they have put more effort in theses areas. It seems logical for the Tories to raise money where it is easiest to do so and spend it where it will have most effect.