
 By Riccardo Crescenzi (LSE, left), Arnaud Dyèvre (LSE, centre), and Frank Neffke (Harvard, right).
Innovation is the motor of long-term economic growth, fostering wealth and prosperity. However, world cities and regions are extremely unequal in their potential to innovate. While some cities and regions generate most of the world patents and concentrate most of R&D spending, the vast majority of places are unable to compete with world-class tech hubs. Inventive activity is concentrated in a restricted club of cities and it is more concentrated than – for example – economic wealth or employment. Membership of the innovators’ club is not only exclusive but also highly stable over time. Enduring inequalities in regions’ innovative performance and their drivers must occupy a more central place in our debates about international development, researchers at LSE and Harvard write. More attention should be placed on the global dimension of innovation and on the circulation of human capital and knowledge.
Income inequalities have deservedly attracted the attention of scholars in multiple disciplines across the Social Sciences and beyond. Recent research has estimated that 10 percent of the world population accounts for 41 percent of the world income [1]. Income inequalities are also extremely pronounced at the local and regional level: in the United States for instance, the 10 percent wealthiest counties account for 71.3 percent of total household income [2].
Another key aspect of societies’ prosperity is even more unequally spread than income, yet has received much less attention: innovation. In 2015, 10 percent of US counties produced as much as 90% of all American patents [3]. The county of Santa Clara alone—home of Apple, Google, Intel and Stanford University— produced 10 percent of all US patents that year. Private and public R&D spending were also concentrated in a few States: the top five US States accounted for 40 percent of it in 2014 [4]. The picture is not very different when looking at Europe where the 10 percent most innovative NUTS 3 regions produced 65 percent of all patents in 2012 [5] and where R&D spending were similarly skewed across regions [6].
Improvements in Information and Communication Technologies (ICTs) have dramatically reduced the cost of transmitting and sharing knowledge and new ideas and knowledge can in principle be transmitted. Never has it been so easy for scientists, academics, managers and executives to travel and communicate with colleagues across the world. Some popular commentators have argued that the ever-increasing integration of national economies and the apparent ease of communicating complex ideas across borders and geographies would mean that any region can now start to innovate, that we could proclaim the “Death of Distance” [7] or that the world has become flat [8].
Yet, despite four decades of globalisation, knowledge remains stubbornly produced in a restricted number of cities, and sticks to them. Top innovations are still “Designed in California”. Why has innovation in fact not spread from the most innovative places to the rest of the world? A lively academic and policy debate has tried to address this question from different standpoints and perspectives. The most important obstacle to the democratisation of innovation is that it is a very complex endeavour. It requires the combination of several highly sophisticated inputs, lots of face-to-face interaction not only between scientists but also between innovation ‘users’ and ‘producers’, as well as strong institutions supportive to risky explorative activities and collaborative work.
Patent inequality in the world
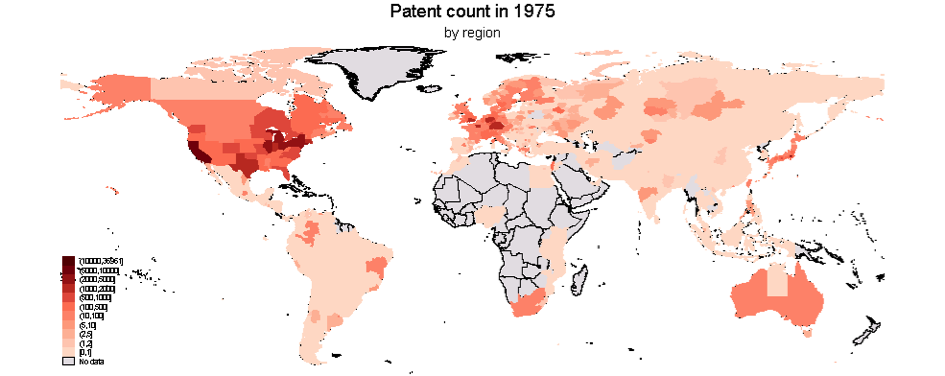
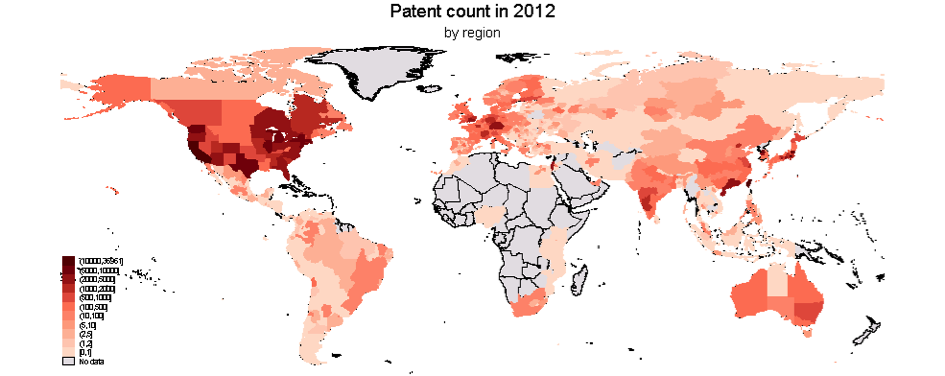
Patents are not the only way to measure regions’ innovativeness, but they capture a relevant aspect of it: they give us a sense of how new products developed by local firms are deemed worthy of intellectual protection from competitors. Using patent data from the US Patent and Trademark Office (the largest Intellectual Property office in the world), we can easily see how unequally spread innovation is in the world. The maps below offer a picture of the distribution of patenting across 1,500 subnational regions (such as the 9 regions of England, or the 17 autonomous regions of Spain for instance) in the world. Not only is patent inequality severe today, it has also been stable over time. With very few exceptions, the most innovative city-regions in 1975 are still the most innovative today. The maps below give a sense of this stability over time; they show the number of patents by regions in 1975 and 2012.
Data: USPTO
Notes: Patents are dated by year of application. We show here the fractional count of patents by region, where inventors are located by their region of residence at the time of application. The fractional counts gives the same weight to all inventors filing the patent, equal to the inverse of the number of inventors.
Data: USPTO
Notes: Patents are dated by year of application.
In spite of notable increases in patent production on the Chinese coast and in India, patents remain mostly filed by countries of the Triad – North America, Europe and Japan – both in 1975 and in 2012. Out of all the regions that were in the top 20% of the patent distribution between 1975 and 1990, none of them fell into the bottom 20% in 1991-2012. Conversely, none of the regions that started with 0 patents reached the top 20%. However, a few regions did make some significant leaps forwards in terms of innovation. Among them, regions at the periphery of Europe such as Algarve in South Portugal managed to build up some innovative capacity while they did not register a single patent before 1990. They did so mostly by attracting German, British, French and Spanish firms in the last decade. In South-East Asia as well, where competition from gigantic neighbours such as India and China is fierce, some regions managed to put themselves on the patent map: Chonburi in Thailand is one of them. The Thai province is now home to branches of big international enterprises who contribute to local innovation such as Meyer Industries, a big cookware manufacturer, and the large American oil and gas firm Exxon Mobil, who refine asphalt there and has filed patents with four local inventors.
You can also observe the inequality of innovation in the world in our data visualisation here.
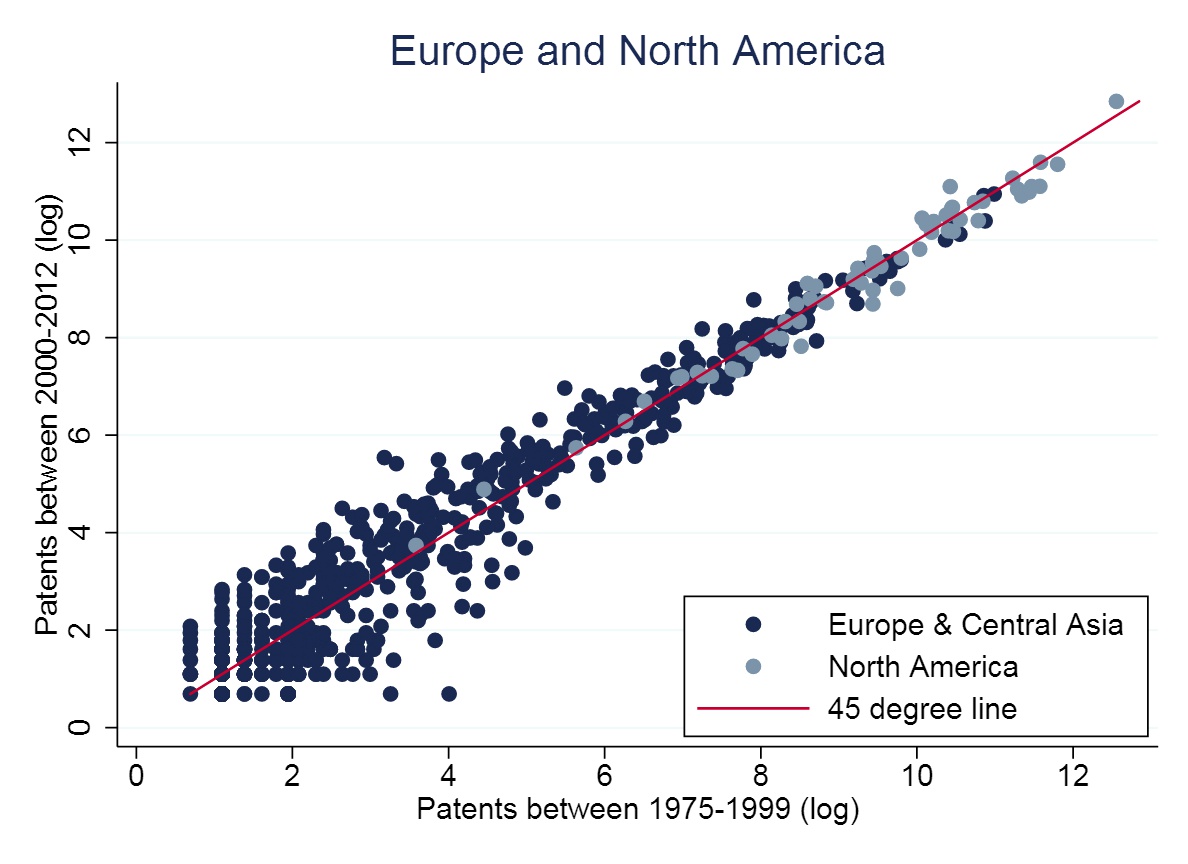
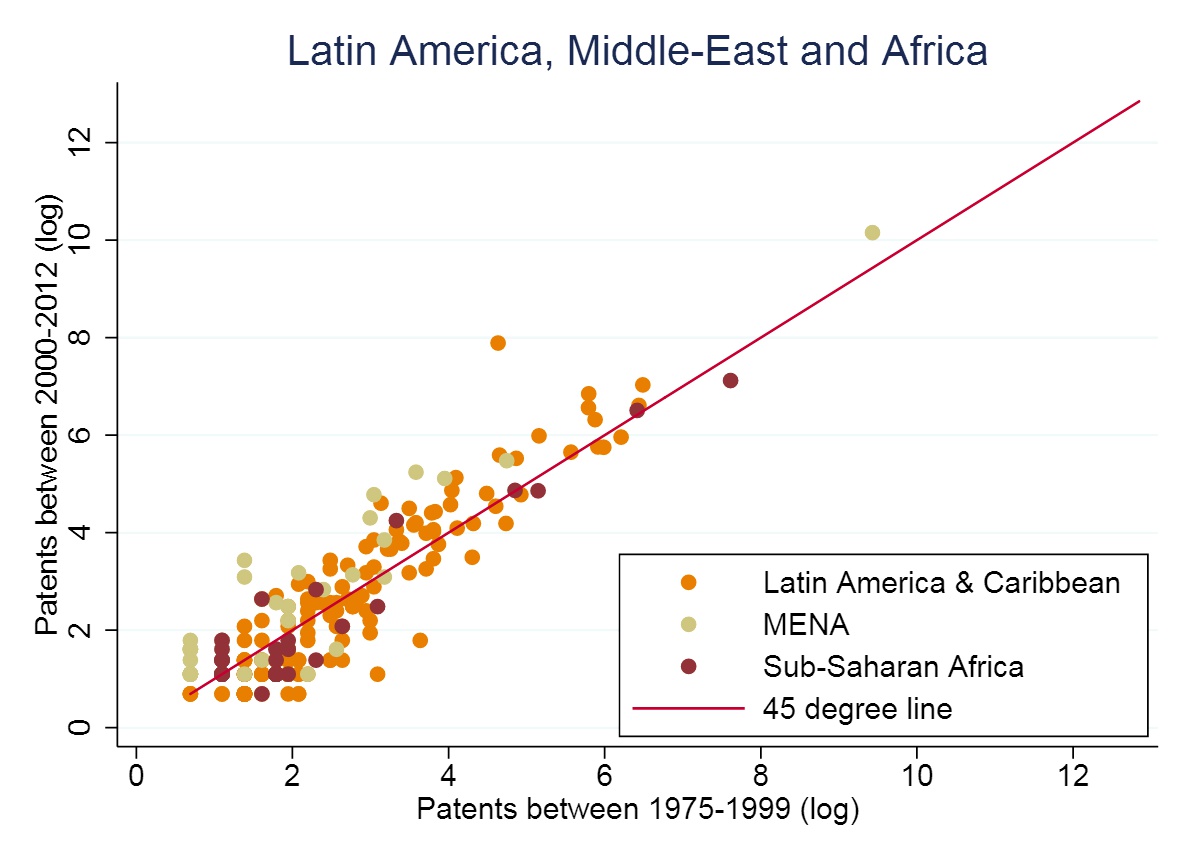
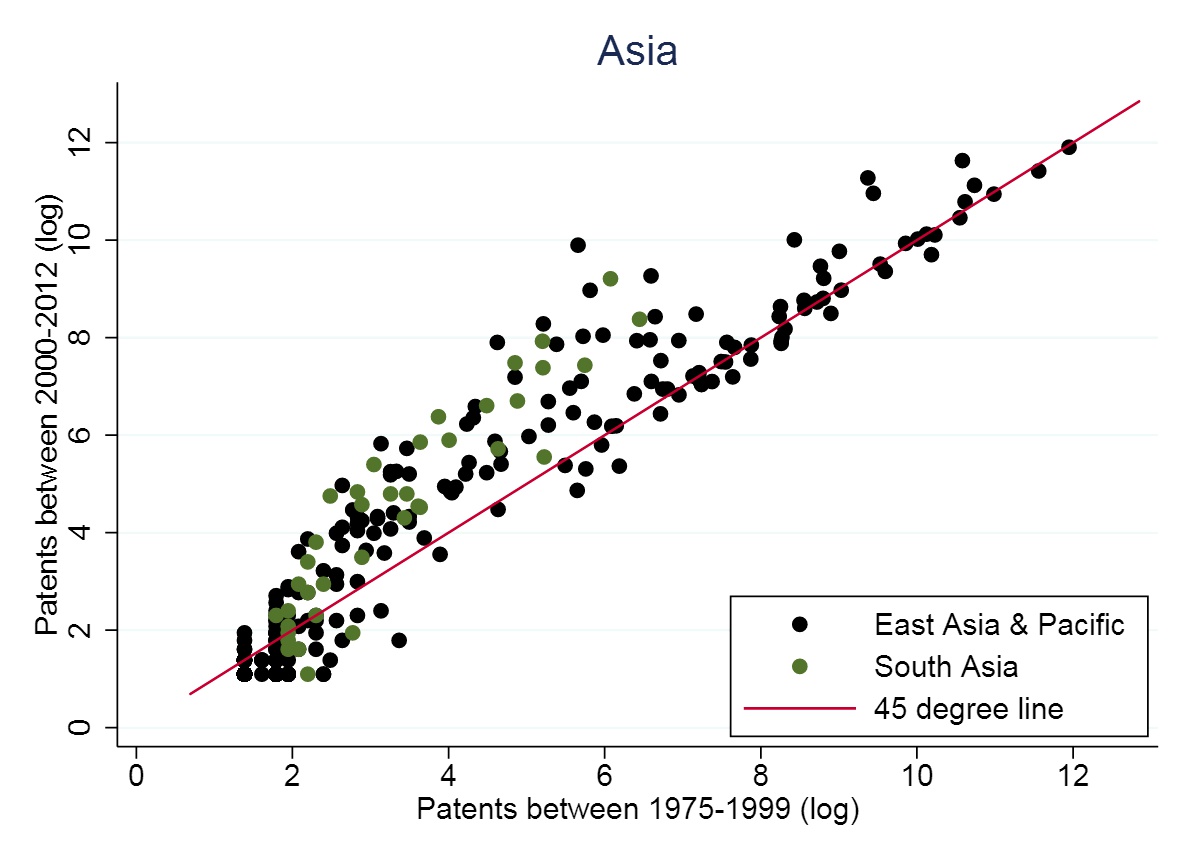
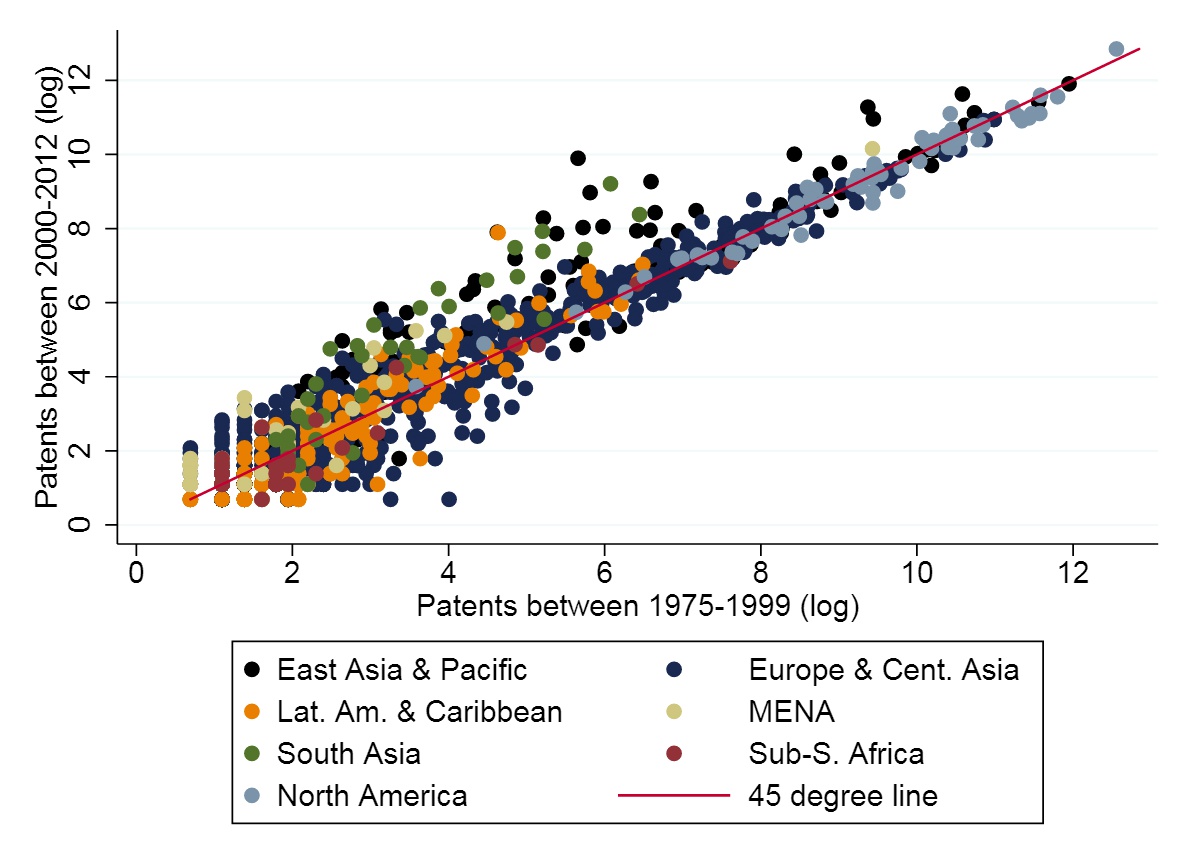
One can also see how the most innovative regions remain innovative over time by plotting the cumulative regional patent count between 1975 and 1999 against the same regional totals between 2000 and 2012. Circles in the graphs below represent sub-national regions. A circle on the 45 degree line is a region whose patent count between 1975 and 1999 is equal to its patent count between 2000 and 2012. A region above it became more innovative and a circle below became less innovative between the two periods. The main trend is stability: most circles are on or around the 45 degree line. Regions in peripheral Europe, in Africa and MENA that started with few patents have few of them after 2000. Regions like Western Europe, North America and Japan in Asia started strong and remained strong.
Data: USPTO
Data: USPTO
Data: USPTO
Data: USPTO
A few exceptions emerge from the global trend: a handful of regions in South-East Asia and in South Asia managed to break out of the path dependency (green and black circles in the top-right chart). These are the Indian and Chinese regions who benefited from the internationalisation of knowledge.
Guandong, the most populous Chinese province and now home of two massive high-tech industrial park in Guangzhou [9], experienced the most spectacular surge in patent production (its corresponding dot on the graph is the furthermost black point from the red line, standing at 10 log patents after 2000, or nearly 20,000 in raw count). The Indian state of Karnataka, where the country’s brightest engineers and most innovative companies cluster, also experienced a remarkable explosion in patent production, jumping from 450 patents produced between 1975 and 1990 to almost 10,000 in the following two decades. Overall, Chinese provinces dominate the league table of the biggest progression in innovative capacity: eight out of the top 20 are in China, six are in India, two in Korea, two in Malaysia, one in Chile and one in Czech Republic. But as remarkable as these technological upgrades are, they are the exception rather than the rule.
Bad news for policy makers: The World is not Flat and … we do not know how you can climb those mountains!
The inequality of the global geography of innovation and its stability over time paint a grim picture for regions willing to become hotspots of innovation. However, a number of regions around the world have still been able to achieve membership of the highly selective world innovation club. What lessons can be learned from regions like Bangalore, coastal China and Korean cities who managed to climb to the top? Once cities and regions realise that the ‘world is not flat’ what options do they have for their future? Policy makers have often tried to actively boost innovation by imitating cases of success. Attempts to use public policies (and tax payer’s money) to replicate the Silicon Valley have flourished everywhere in the world [10] with very limited success. This ‘boulevard of broken dreams’ reflects the many limitations of mainstream innovation policies and the challenges they need to address – from impatient policy makers in search of short-term electoral rewards to rent seeking behaviours of local firms. However, it also shows how limited our understanding still remains of the mechanics of innovation, of how places get started with it and how their innovation trajectory accelerates (or not) over time. Thick narratives have provided highly influential accounts of the success of the most highly innovative places in the world – from the Silicon Valley to Bangalore – but we are still unclear on what can be generalised from individual cases and successfully transferred to other local contexts.
Innovation and development policies around the world call for a stronger evidence base. More research is needed on a truly global scale in order to identify what can be generalised across continents, countries and regions and what – instead – remains highly idiosyncratic and context-specific. New evidence is needed on the global inter-connectivity between regions of the world in order to shed new light on how human capital and knowledge move around the globe and how (and under what conditions) they contribute to the success (or decline) of their host economies. The world is certainly not flat but how to climb its mountains is far from clear!
This post is based on ongoing research by Riccardo Crescenzi (LSE), Arnaud Dyèvre (LSE), and Frank Neffke (Harvard). It represents the views of the authors and not those of the GILD blog, nor the LSE.