
 The primary research material of Charles Booth’s pioneering study of poverty in London survives in the form of the famous poverty maps and notebooks. Neil Stewart and Andy Jack recount how the LSE Library worked to refresh and update the Booth web presence to properly reflect the significance of this archive. Also, on International Digital Preservation Day, the authors outline aspects of this work that can be seen as a form of digital preservation; from the ongoing, active management of this digital resource, to its open licenses that allow for widespread distribution and reuse.
Charles Booth was a businessman, philanthropist, and social scientist. He funded and led the research on a remarkable, pioneering study of poverty in London, the Inquiry into the Life and Labour of the People in London (in four editions, 1886-1903). It was one of a number of studies of poverty in Victorian and Edwardian London and Britain more widely, but it is the only one where the primary research material has survived in full: the famous poverty maps and the notebooks in which Booth and his team recorded their findings.
LSE Library is the custodian of the Charles Booth archive. Since 2002, the Library has made available a website dedicated to Booth and his work. This post tells the story of how we collaborated to refresh and update our Booth web presence to reflect the significance of this archive.
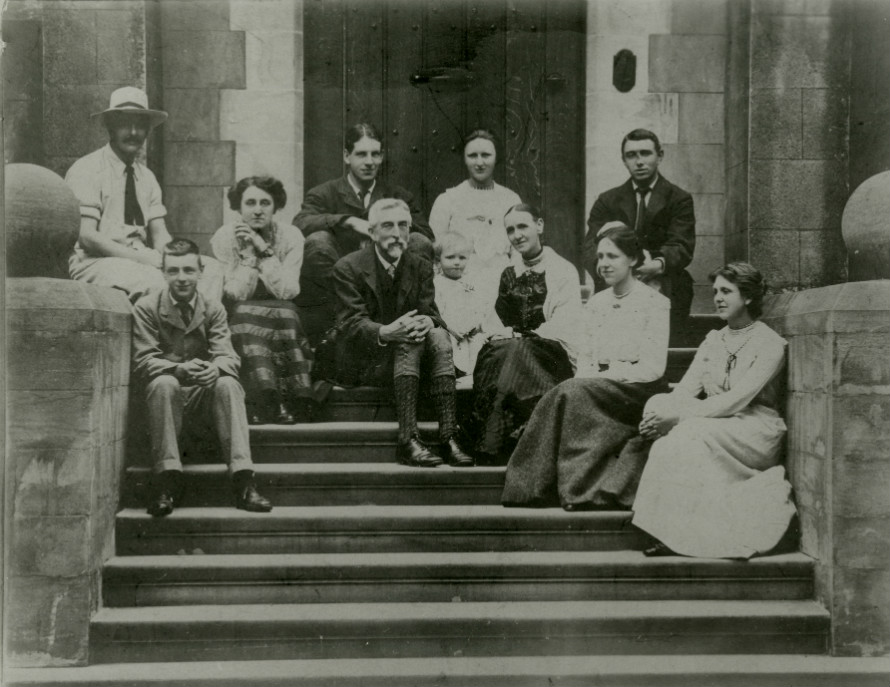
 Charles Booth with members of his family on the steps of Gracedieu Manor, 1902. Image available at Charles Booth’s London, courtesy of Senate House Library.
Background
Up until 2016 we had two websites that were used to share the digitised elements of the Booth archive with the world. The first, The Charles Booth Online Archive, was built in 2002, and although it won awards at the time, it was looking tired and utilising out of date software components. Although it was doing a reasonable job and was well-used, we knew this flagship collection required a more impressive and usable online profile.
In 2012 we had embarked on a project alongside colleagues in the Department of Geography and Environment to “mobilise” the archive – not as a native app (though we did explore that option), but as a responsive website. This was to enable students out in the field to use the archive on their mobile devices at street level. This mobile version (a prototype that never got out of public beta) was called PhoneBooth, and despite its limitations we were proud of it. However, we knew that neither site was good enough and in early 2016 we had the funds, staff resources (a project manager, an archival curator, a metadata specialist, a developer, a UX researcher, and a web editor) and, importantly, the chutzpah to get on and do something about it. This also coincided with events to commemorate Booth’s work and the 100th anniversary of his death in November 2016.
Our assumptions
Once everything was in place to start the project we gathered and looked at our assumptions about it. There were a number of these, and plenty of strong opinions about what we should do, but the two main assumptions we had were problematic and needed to be resolved. Fortunately we knew we had to challenge our assumptions by undertaking user experience (UX) research.
| Assumption | Research |
|---|---|
| We should build an app. | Google Analytics shows most use of current site on desktop. |
| The maps page gets a lot of hits; that must mean the users only care about the maps and they should be the entry point for the site. | Surveys showed it’s the maps that hook you in, but the notebooks that make you stay and engage with the site. A traditional home page signposting both equally would be desirable. |
Just looking at analytics showed us only part of the picture. We could see what people were doing, but not why they were doing it. The UX research filled in the gaps in our knowledge.
After looking at who our users were and considering what they were trying to accomplish, we narrowed this down to two main tasks: browsing and searching the maps and browsing and searching the notebooks. One significant thing that came out of this was the acknowledgement (much to the delight of our web editor) that we could strip back non-essential content from the old site so the new one was lean and focused on user requirements and tasks.
User Experience (UX) research as part of the process
Our approach to developing the new Booth site was user-centred from the beginning, partly because we knew we were prone to the kind of assumptions mentioned above and partly because our (now-departed) UX researcher forcefully insisted on that being the case. UX research was baked into the project and took the form of conducting and/or analysing:
- Google Analytics
- Surveys
- Competitor analysis
- Workshops
- Audience analysis
This gave us a much better idea of what the site should do, what it should look like, and who it was for. This was invaluable knowledge to inform development way before we even started to build the site.


UX research continues to be a focus for future development of the site. Now it is live we are in the position to be able to perform usability testing with users of the site, whom we are committed to putting at the centre of future developments. We also have a basic dashboard we use to monitor some site analytics and maintain familiarity with aspects of usage.
(Re)building Charles Booth’s London
Now we knew what we wanted (but not necessarily how we needed it to look) our Developer, Thom Carter, set to work to build the application that underlies the website. Thom has written an excellent account of the technical work that went into rebuilding the application, which we will not rehash here. If you want to learn more about the process of the build then read his post “(Re)building Charles Booth’s London”.
Design
Even though we were working with an external web design agency, we wanted to ensure we had sufficient influence over as many aspects of the design as possible. This included the development of the information architecture of the site, the mapping out of journeys, sequencing of user interactions, and the site’s overall visual design. Because we gave all of this so much thought we were able to communicate our requirements very clearly to the agency. They took all this on board and came up with two distinct designs that we took out for online and in-person preference testing with colleagues, students, and literally anyone else willing to provide an opinion.
One of the designs took inspiration from the colour palette that Booth used on the poverty maps and Victoriana more generally, while the other drew on LSE’s corporate web style:


Ultimately our research showed that people preferred individual elements of each set of visuals so we decided to get the scissors and glue out. We cut out elements from each design to create a “Frankenstein’s monster” design which combined the best bits of both work. This was the result:

We then presented this back to our agency and they brought Frankenstein’s monster to life!
The final product
What we built in the end was a site that put the maps and notebooks at the same level of importance, to demonstrate the research value of both sets of material; provided plenty of background information about Charles Booth, the study and various other aspects of the archive; provided access to Public Domain high-resolution files of the maps that people can download and use for whatever purpose they like (we hear that many maps now adorn walls across London, including in a few pubs); and, finally, provided a set of curated highlights on topics designed to offer intriguing entry points to the material for those interested.
Charles Booth’s London and digital preservation
As today is International Digital Preservation Day, we promised we would write something about how CBL is a paragon of digital preservation. This would be an exaggeration. The web application we created is, of course, securely hosted and backed up, like any well-managed website. We haven’t applied full-scale digital preservation techniques to the material on the site, as yet, as our digital preservation capabilities are still under development.
However, we would argue that the approach we have taken – committed, active, and ongoing management and development of a digital resource – can be seen as a form of digital preservation in its own right. In our view this approach is as powerful as a “systems-based” approach, which views digital preservation as a matter of dropping digital objects into a store and then running fixity checks and so on to ensure objects remain stable. Instead, active management keeps digital resources current and living. We would also point to the way in which we have openly licensed the content in CBL, meaning that both the original map sheets and the notebooks are downloadable, facilitating what we might term “distributed preservation”, along with all the benefits of open content reuse that libraries should be encouraging.
Charles Booth’s London: the future
We have a number of further developments we would like to explore with CBL, and intend to take an iterative, agile approach to these. We have a long list of work carried over from the main project, so we see the work as never-ending, as improving a website should be. The most pressing piece of work will be to add more digitised notebooks to the site. This round of digitisation has, more or less, completed the archive in digital form, and will allow the complete set of Booth’s research to be made available via the open web for the first time.
Second, we need to think more about the original poverty maps. As things stand, the modern day “overlay” of the map is searchable, in much the same way that modern mapping applications are searchable. However this does not apply to the poverty maps. To our knowledge there is no gazetteer of Victorian London to which we can refer, and our team’s analysis shows that some 50% of the streets in Booth’s time have since been renamed, no longer exist, or have otherwise changed so that they no longer match the geography of modern London. This means that searching the Victorian map is unreliable: for example it is not currently possible to search for Great Wild Street (found at this location on the Booth Map), as it no longer exists. To address this deficiency we would like to create a gazetteer of Victorian London. We are exploring options around crowdsourcing this information, including talking to our colleagues at the Institute of Historical Research’s Layers of London project.
Finally, we would like to see increasing impact for the site, particularly for teaching and learning purposes, an area we know is on the increase. We would also like to see increasing use more generally, for example to research family history and the history of London. If you would like to tell us about your use of CBL for any of these purposes, we would love to hear from you – please get in touch.
Explore Charles Booth’s London online.
Featured image taken from Charles Booth’s London; Map Descriptive of London Poverty, 1898-9; Sheet 6 – West Central District (available under a Public Domain Mark 1.0 license).
Note: This article gives the views of the authors, and not the position of the LSE Impact Blog, nor of the London School of Economics. Please review our comments policy if you have any concerns on posting a comment below.
About the authors
Neil Stewart is the Digital Library Manager at the Library of the London School of Economics and Political Science (LSE). He manages LSE’s Digital Library, an online repository of digitised and born digital materials from LSE Library’s rich collection of social science holdings. He is interested in digital scholarship, digitisation for scholarly reuse, research data management, copyright and intellectual property, open access, open science, and web technologies for libraries.
Andy Jack is the Web Editor at the Library of the London School of Economics and Political Science (LSE). He manages LSE Library website, the main way in which the Library expresses information about its collections and services online. He is interested in content strategy, web design, user experience research, analytics, cycling, and dad jokes.


