 Steven Ayres explores demographic differences and voting patterns in Scotland’s independence referendum. He finds a strong positive relationship between the proportion of ‘Yes’ votes and out of work benefit claimants, and that areas with a high proportion of people born elsewhere in the UK demonstrated the weakest support for ‘Yes’. He also shows that areas with the highest vote share for the SNP in the 2014 European Parliament election did not actually see the strongest support for independence. Finally, the data reveals a clear negative association with ‘Yes’ and the proportion of population in the 65+ age group, although the relationship appears weaker than for other variables.
In Thursday’s referendum, Scottish independence was rejected by a margin of around 10 percentage points. Yet the 1,617,989 votes cast in favour of leaving the UK – representing 44.7% of total voters and roughly 37% of all those in the country aged 16 or over – indicate clear differences of opinion on the question of independence.
In the lead up to the referendum, polls consistently pointed towards a variety of demographic and social foundations for these differences, from age and gender to levels of economic deprivation and country of birth. The purpose here is to explore how regional differences with respect to these factors may have played a role in the different results observed across Scotland. In short, what is so different between say Dundee, where 57.3% of votes were cast for ‘Yes’, and the Orkney Islands with 32.8%?
The question “Should Scotland be an independent country?” brought Scottish voters out in record numbers, with 3,619,985 people casting their vote. The turnout of 85% was 21 percentage points higher than the 2010 General Election and 35 percentage points higher than the 2011 Scottish Parliament Election. The map below indicates how voters turned out across the country with the coloured areas in the map on the left showing those LAs where the majority voted ‘Yes’, and the one on the right those that majority voted ‘No’. Darker shades represent higher turnout.

As in general elections, the referendum took place as a secret ballot and therefore we are unable to investigate voting patterns on the basis of characteristics of individual voters. Opinion polls offer some clues about such patterns, yet here we are making use of regional data to investigate how voting may have varied according to regional characteristics.
The table below shows the strength of association between a variety of different characteristics at the Local Authority (LA) level and the proportion that voted ‘Yes’ in that LA. The correlation coefficient represents the strength of the relationship and is characterised by a value between -1 and 1. A positive number indicates a positive relationship (as one variable increases, the other also increases) and a negative number, a negative relationship (as one increases, the other decreases). The closer to 1 (or -1) this value is, the stronger the relationship.
Table 1: Relationship between various demographic and social variables and the ‘Yes’ vote

The charts below capture these relationships, with each dot representing a Local Authority – ‘No’ LAs are represented in red and ‘Yes’ LAs in orange. The green line depicts the line that best fits the data points ( i.e. is closest to as many of them as possible) and indicates the general direction of the relationship. It is important to note that correlation does not necessarily imply causation. In other words, a relationship between two variables does not necessarily mean that the change in one causes the change in the other.
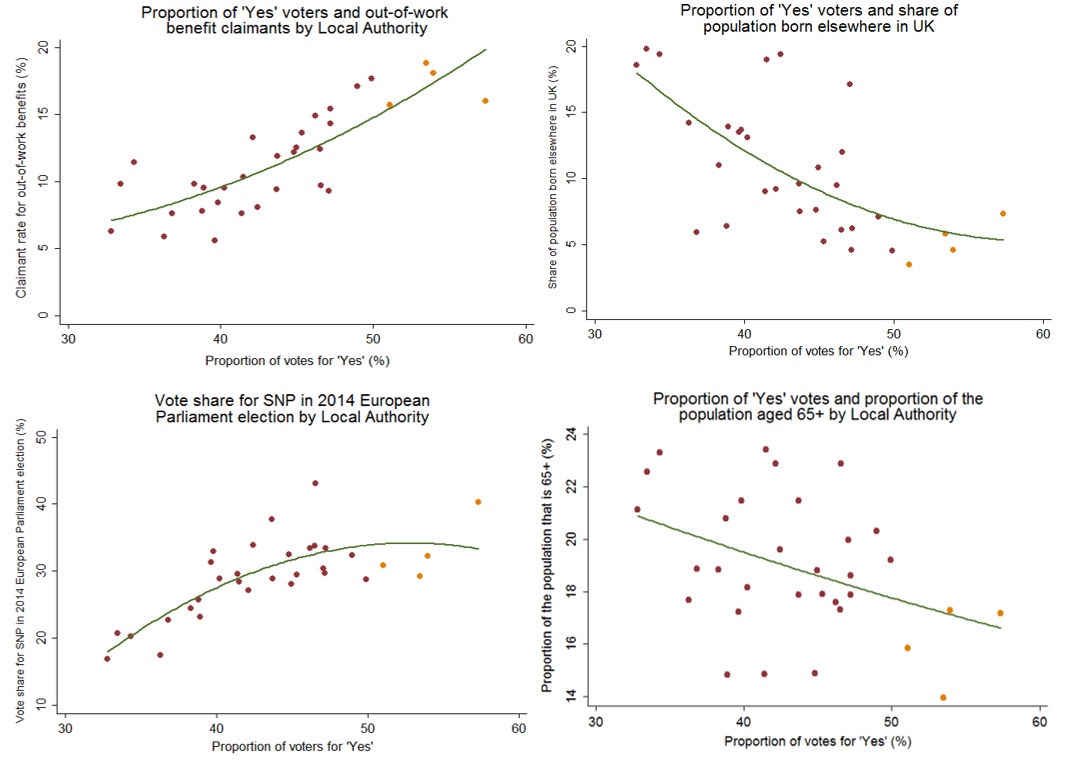
Out-of-work benefit claimant rates
Interestingly, the four LAs with a majority for ‘Yes’ – Glasgow City, West Dunbartonshire, Dundee City and North Lanarkshire – rank first, second, fifth and sixth in terms of claimant rates respectively. This is in contrast with the ten LAs with the lowest claimant count who saw average support for ‘Yes’ of under 40%. A similarly strong relationship was observed when isolating Jobseeker’s Allowance (JSA) – a component of out-of-work benefits.
SNP vote share in 2014
It is also important to note that voting behaviour is rarely exactly as these factors might predict across all areas. In the two previous examples, the ‘Yes’ share in the Highlands is above what might have been predicted from benefit claimant rates and rates of people born elsewhere in the UK. This highlights the importance of regional differences and suggests there may be other factors that play a more important role in driving voting behaviour in the Highlands. As the relevant chart shows, the areas with the highest vote share for the SNP in the 2014 European Parliament election did not actually see the strongest support for independence. This is highlighted by the shape of the curve, indicating that up to a point of around 50%, there is indeed a positive relationship between ‘Yes’ support in the referendum and SNP support in the EP elections. However, as we move into a ‘Yes’ majority there is a visible plateau in the relationship (as shown by the flattening of the curve).
This curious association is best exemplified by the LA of Eilean Siar, where the SNP received its highest vote share in the 2014 EP elections (43%) but which rejected independence by a margin of 7 percentage points. Perth & Kinross and Aberdeenshire were ranked 8th and 12th in terms of SNP support in 2012, but 23rd and 24th for support for independence.
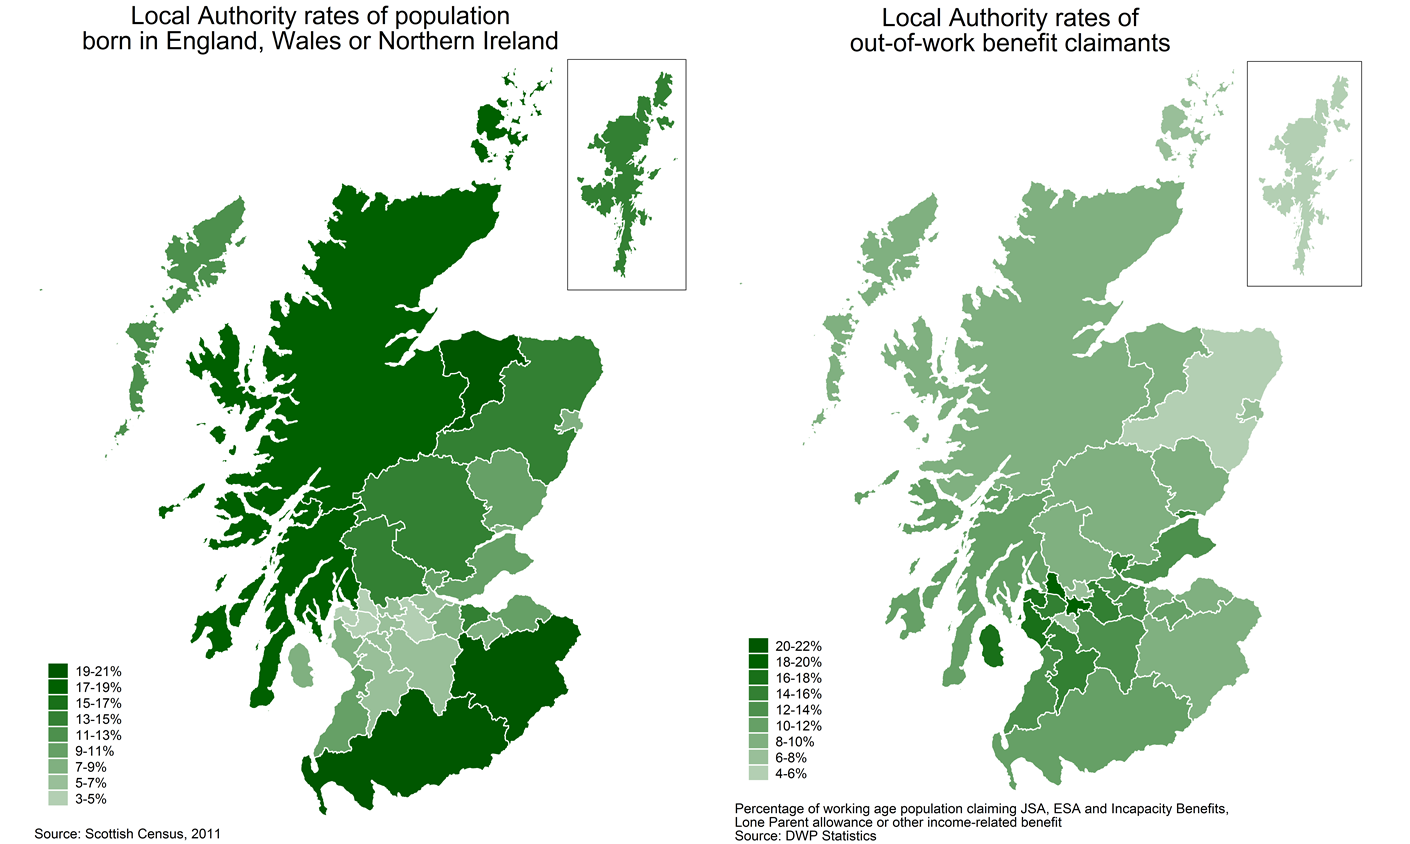
Born elsewhere in the UK
The third strongest correlation of the observed variables was between the proportion of the population born in England, Wales or Northern Ireland and the ‘Yes’ vote. Areas with a high proportion of people born elsewhere in the UK demonstrated the weakest support for ‘Yes’. In the case of the Scottish Borders and Dumfries and Galloway – the two LAs that share a border with England – this seems fairly intuitive. One might expect a higher concentration of people born elsewhere in the UK in these areas due to the close proximity to England, as well as a stronger desire to remain within the UK due to the social and economic ties such proximity brings. Interestingly, it is the urban areas in the centre of the country that have the lowest share of English, Welsh or Northern Irish and the highest support for ‘Yes’. Even in those central areas where a majority voted for ‘No’ such as North and East Ayrshire, the result was closer than the average (a difference of 2 and 5 points, respectively).
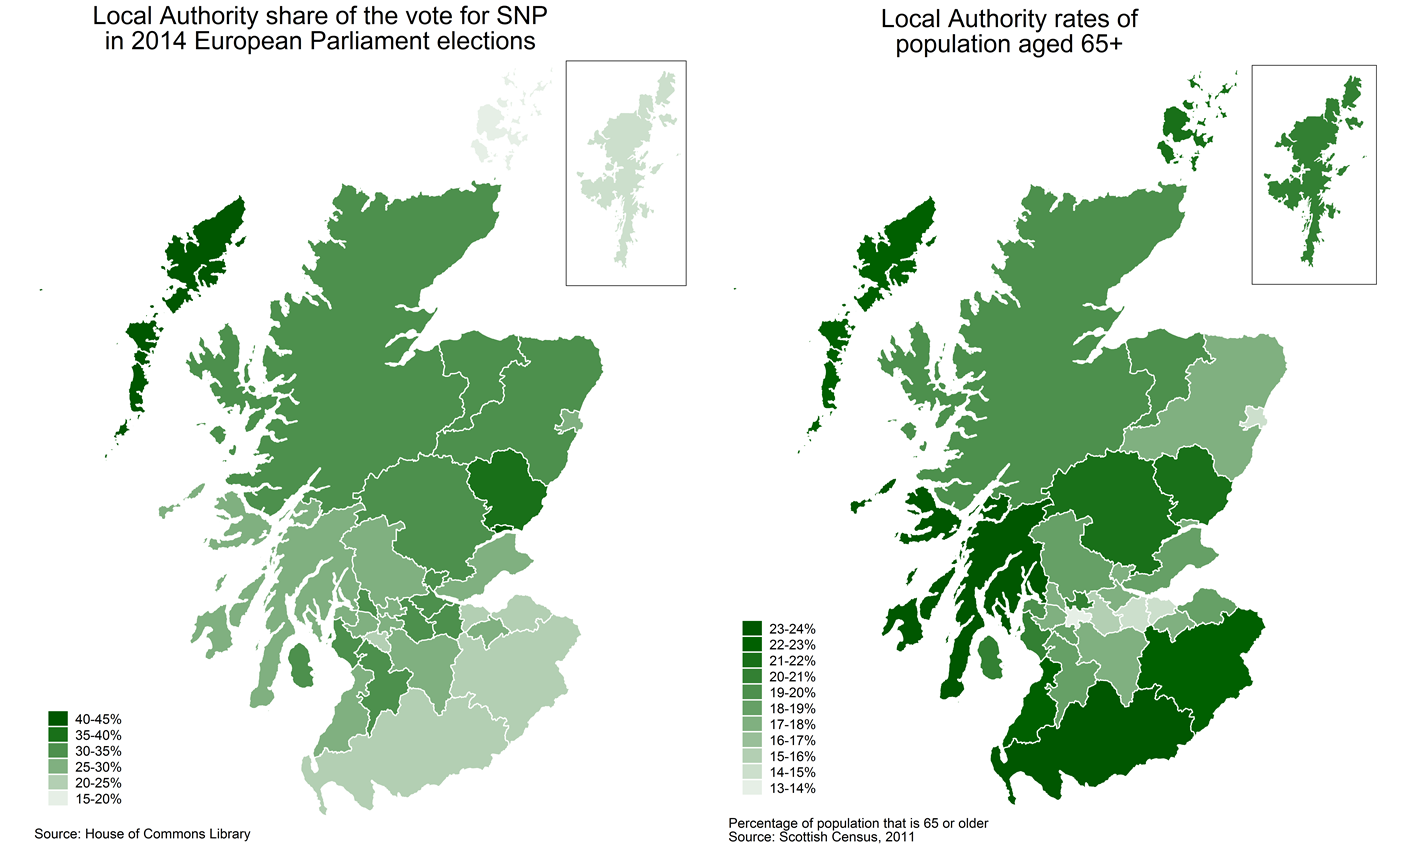
People aged 65 and older
Age was another factor consistently outlined by pre-referendum polls as a predictor of which way people might vote, which was confirmed in polls by YouGov immediately before the referendum and in polls by Lord Ashcroft after. It is clear from the map below that the LAs with the highest support for independence were among the lowest in terms of their rates of 65+ population. The four LAs that saw a ‘Yes’ majority are all ranked in the lowest eight in terms of their share of the population falling into the 65+ age group. While there is a clear association, the relationship appears weaker than for other variables. For example, despite having roughly the same proportion of their population in the 65+ group (17.2%), Dundee and Aberdeenshire saw wide differences in support for independence with 57.4% and 39.6% for ‘Yes’ respectively. Looking at the chart the weakness of this relationship is visible based on how the points are relatively loosely clustered around the trend line.
Further to the above charts, the four variables are shown geographically in the maps (click on the images to enlarge).
Note: This article was originally published on the House of Commons Library blog, Second Reading, and gives the views of the author, and not the position of the British Politics and Policy blog, nor of the London School of Economics. Please read our comments policy before posting. Featured image credit:
Steven Ayres is a former Economics and Development Consultant with the United Nations in Bangkok and now works as a Statistical Researcher for the House of Commons Library, focusing on the issues of democracy, social security and immigration.


1 Comments