 Bed occupancy rates in acute and general hospital services are likely to climb well above 90 per cent by the end of the financial year. Simon Bastow examines the systemic effects of this on A&E performance, and finds that only very few hospitals can run continually high bed occupancy while maintaining A&E performance.
The political and media storm around crisis in A&E in last few months raises perennial questions about what is an optimal or at least an ‘about right’ rate of capacity for running public services. Is it 80 per cent? Or is that too low given improvements in bed management and modelling tools? Perhaps 90 per cent? But if we run public sector systems continually at ever-higher capacity, services deteriorate or, from time to time, crises occur.
Optimal capacity questions are not new. A report in February 2000 by the UK National Audit Office estimated the average bed occupancy rate for acute and general services in English hospitals at 81 per cent for 1997-98. It cited a short 1999 BMJ paper that argued that any occupancy rate over 85 per cent risked bed shortages and periodic bed crises. Yet subsequent research has pointed out the ‘myth’ of ideal occupancy rates, arguing that they are often arbitrary and ignore the fact that different rates work in different contexts.
Recent data on NHS occupancy rates show that hospitals have let them creep upwards. Figure 1 shows the distribution of average occupancy rates for all NHS Trusts with major A&E departments. In 2013, the median rate of NHS Trusts with major A&E services increased to around 91 per cent, and this is set to increase further into the nineties once figures for the current financial year are reported.
Figure 1: Average occupancy rates for acute and general hospital services
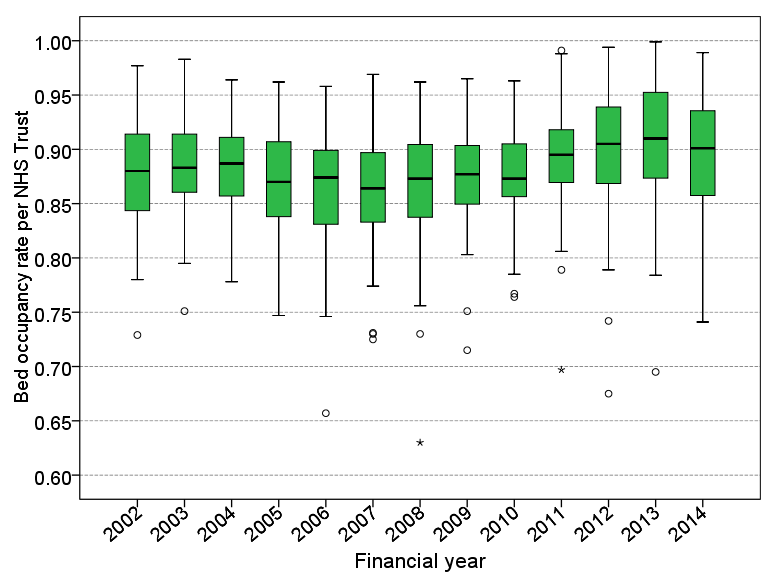
Source: My analysis of NHS England
Note: Boxplot show the distribution of acute and general occupancy rates across NHS Trusts in England. The green boxes represent the interquartile range, and the bars represent top and bottom quartiles. Outliers are also shown. The median of the distribution is the thick black line.
It is interesting to compare hospital occupancy rates with other core public services that have to respond to ‘surges’ in demand. Figure 2 shows the rate for local prisons in England and Wales.
Figure 2: Average occupancy rates for local prisons
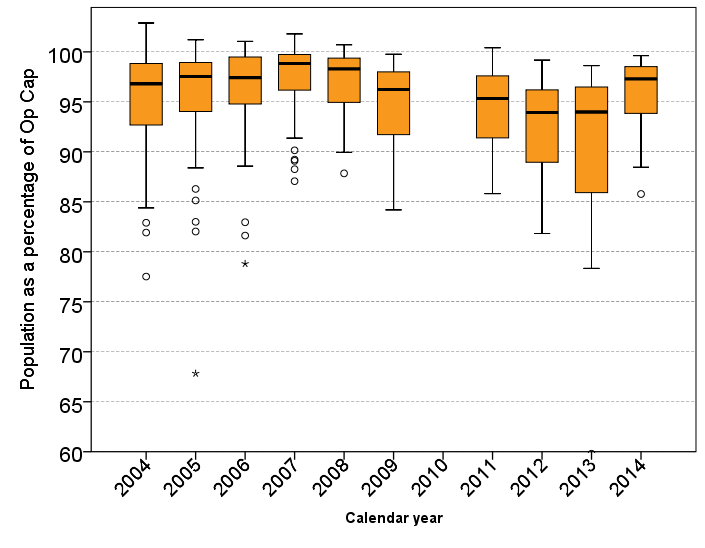
Source: My analysis of Ministry of Justice data
Note: Data for prisons is not available prior to 2004, and for 2010 is temporarily unavailable.
In both charts we can see signs that ‘crisis’ has led to easing off in occupancy rates, but also how capacity has a tendency to creep up again. The marginal reduction in hospital bed occupancy rates from 2003 was partly a response to the realisation that English hospitals had one of the highest rates of MRSA and hospital-acquired infection in Europe (see NAO report p25). In prisons, we can see too how perilously close prisons came to capacity crisis in 2007. Yet this crisis led to an easing off of occupancy rates from 2007 onwards, something that gave a degree of ‘headroom’ to focus more intently on setting up the system to reduce reoffending. By 2013 prison occupancy rates were broadly similar to hospitals.
To what extent has capacity shortage in acute and general beds aggravated the current crisis in A&E services? Admissions from A&E to hospital have increased by nearly 100 per cent since 2002, so clearly heightened demand from A&E has put pressure on bed rates. But also lack of bed capacity generates significant pushback on A&E services, and makes it harder for A&E to move patients into and through the system. Hospitals have had to cancel routine operations to keep sufficient capacity to cope with admissions from A&E. Again, there is nothing new here – the NAO report reminds us that hospitals were routinely cancelling non-urgent operations in 1997 when the occupancy rate was at 81 per cent.
What is the relationship between pressure on hospital beds and general performance of A&E? Figure 3 shows the boxplot distribution of patients visiting A&E who are cleared inside 4 hours – the current obsession of the media and politicians.
Figure 3: Proportion of patients visiting major A&E departments who are dealt with inside 4 hours, by quarter
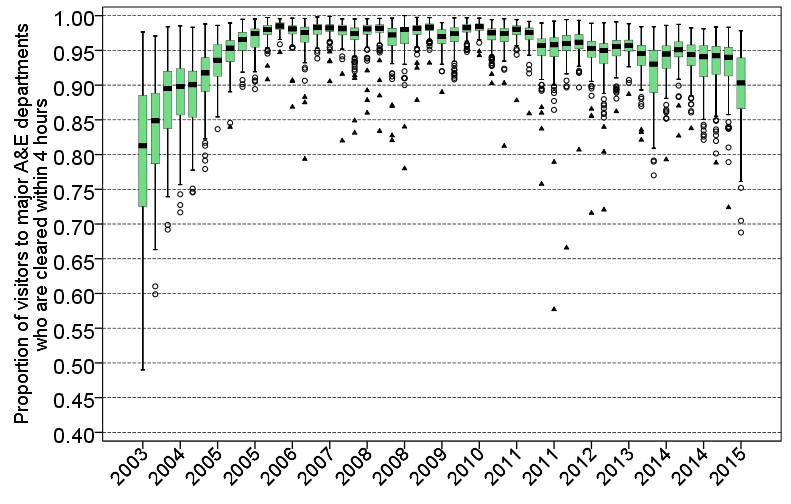
Source:My analysis of NHS England data
Striking is the sheer variation in performance prior to 2004. We can want for no clearer illustration of what the introduction of the 4-hour target did for the ‘official’ performance of A&E services. By 2006, practically all major departments were reporting at least 95 per cent clearance rates. Yet since 2010, we have seen an unravelling in this consistently high level of clearance, and in the third quarter of 2015, a drop in the median by nearly 5 percent. Put in perspective, however, this is nowhere near the erratic performance distribution in 2003.
We can show some of the complexity in this relationship by plotting bed occupancy stress against A&E performance stress (see Figure 4). On the horizontal axis I have charted the number of years since 2004 in which average bed occupancy rates have been greater than 90 per cent. On the vertical axis I have charted the number of quarters since 2005 (43 in total) in which 4-hour A&E clearance rates have been less than 95 per cent. Both seem reasonable proxies for stress. The dots are NHS Trusts – some conceal more than one Trust.
Figure 4: Relationship between occupancy rates and A&E performance in Trusts with major A&E departments
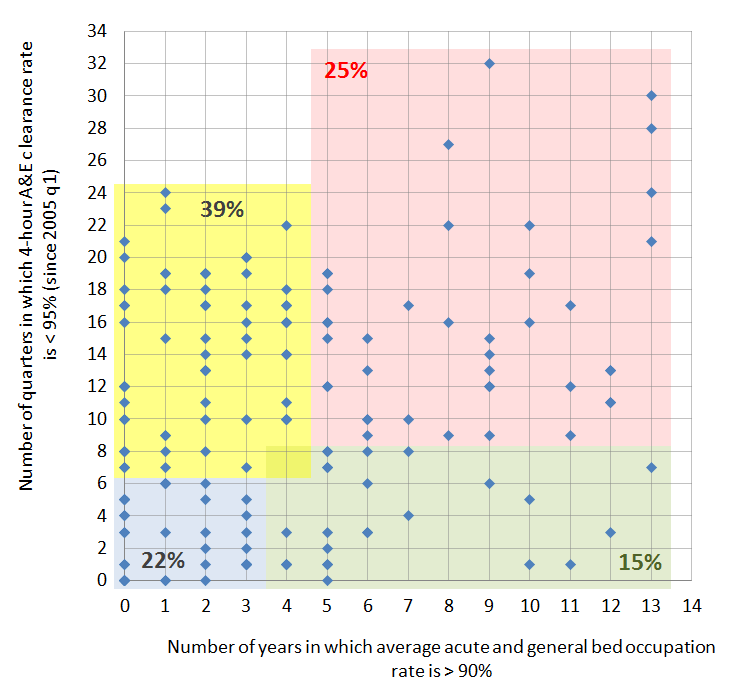
Not surprisingly there are few obvious clusters or relationships. I have mapped out four areas that represent quite different dynamics between capacity and performance:
- Roughly 39 per cent of Trusts (yellow) have struggled with A&E performance despite relatively low levels of bed occupancy. Clearly, other factors impinge on A&E performance, not least staffing levels and staff cultures, nature of demand of A&E services, and so on. This reminds us that the pressures on A&E are multifaceted and complex, and require joined-up thinking.
- 25 per cent (red) have struggled with A&E performance and have had high levels of bed occupancy. It is interesting that 6 of the 8 Trusts recently reporting major incidents are in this category – suggesting that high bed occupancy is both cause and symptom of wider dysfunction.
- 22 per cent (blue) have experienced only minor problems despite severe economic downturns and austerity pressures. This suggests effective management and staffing, and ability to respond to surge problems.
- 15 per cent (green) have had few problems with A&E yet have managed to run the bed occupancy rates at comparatively high levels.
The proportion of hospitals that are able to run problem-free with continually high levels of bed occupancy is no doubt significantly smaller than 15 per cent. Indeed there are only a handful of Trusts that have managed to run at very high occupancy rates and not experienced some degree of A&E performance stress – the probable lesson being that for a very small number this might be possible, but for the majority, occupancy rates are something that must be kept in constant and manageable check.
Note: This article gives the views of the author, and not the position of the British Politics and Policy blog, nor of the London School of Economics. Please read our comments policy before posting.
Simon Bastow (@simonjbastow) is a Senior Research Fellow at the LSE Public Policy Group. He published Governance, performance and capacity stress: The chronic case of prison crowding in 2013, and is currently working on a follow-up ‘Capacity stress: How public sector systems cope and perform’.