 In their new paper, Christopher Hood and Ruth Dixon show that cutting administration costs is difficult both for the government to do and for the public to evaluate.

The current UK coalition government aims to cut administrative costs in central government by 34 per cent between 2010 and 2014. So has there ever been a period in the recent past where comparable reductions have been achieved? Examining central government administration costs data from the past three decades, we find there are no reductions on anything like the scale currently planned were achieved over that time, even – indeed especially – during Margaret Thatcher’s premiership. We also find that despite the recurring emphasis on efficiency and cost containment, government made it almost impossible to keep track of its performance over time because of instability in the way it reported its running or administrative costs.
Looking Back to Previous Attempts to Cut Costs
With budget cuts, especially of running costs, central to the policy agenda of many governments, in the UK and elsewhere, can we learn from the history of past attempts to improve management and raise efficiency in the public services? After all, it is often said that the managerialism associated with the Thatcher government in the UK in the 1980s focused on bureaucratic cost-cutting, and since then there have been many efficiency reviews intended to cut government’s costs and improve performance by means such as better management or IT applications.
Three Strands of Evidence: Looking at the case of the UK, our study examines what happened over three decades to:
- Central government running or administration costs
- Tax collection costs
- Central government paybill costs
Exhibit A: UK Central Government Running Costs 1980-2009
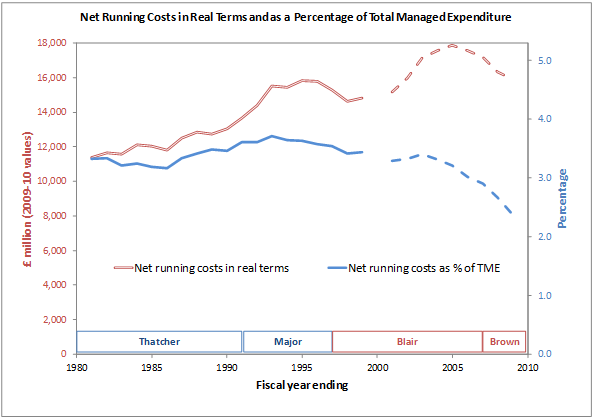
Figure 1 shows running costs of central government departments (excluding the Ministry of Defence) net of fees and charges for goods and services (e.g. issuing passports), in 2009-10 prices using the GDP deflator.
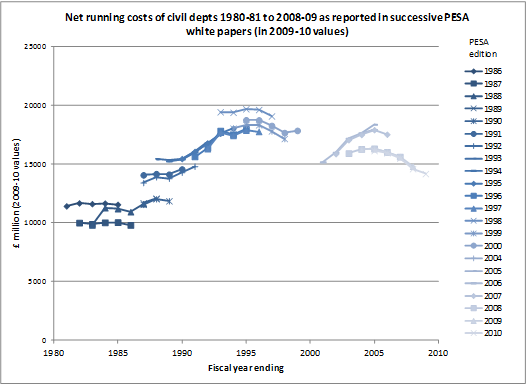
The numbers in Figure 1 are from the Public Expenditure Statistical Analyses (PESA), the official annual reports of government spending (http://www.hm-treasury.gov.uk/pespub_index.htm). But these costs are not presented as a single series. Instead, they appear in short runs, with frequent and sometimes major reclassification changes as is shown in Figure 2.
Figure 2 shows net running costs of civil departments as reported in successive editions of PESA, in 2009-10 prices using the GDP deflator.
To construct Figure 1, we expressed the numbers in a constant series by reverting to the original basis of classification. The dotted lines in Figure 1 represent numbers that are not fully comparable with the earlier series because after the Gershon Efficiency Review of 2004-5 there was no overlap in the reporting of the figures that would enable us to express them in the 1980s format, and also, ‘Administration costs’ after that break meant something different from before that time.
As can be seen from the upper (red) line in Figure 1 the net running costs increased strikingly in real terms throughout this period apart from the mid-1990s and the late 2000s, and ended higher in real terms at the end of each Prime Minister’s tenure than they had been at the start.
Though current policy aims are to cut absolute, not relative, administration costs, we get a different picture if we relate running costs to total spending, and the lower (blue) line in Figure 1 depicts what happened to running costs (net of fees and charges) as a percentage of ’Total Managed Expenditure’ (TME). That ratio remained fairly constant until the early 2000s and then fell by about one percentage point. However, UK public spending was increasing at an accelerating rate over this period and approximately doubled between 1990 and 2009 in real terms. That poses a question to which there can be no definitive answer: is a one percentage point fall in relative administration costs during a time when public spending doubles evidence of good performance?
Exhibit B. Tax Collection Costs
Tax collection is central to deficit-reduction strategy, and we might also expect tax collection to be amenable to productivity increases through better management or new IT applications. We found a fall in the relative collection costs (i.e. cost to yield) since the early 1980s for both Inland Revenue and Customs & Excise (which merged to form HM Revenue & Customs in 2005). But that was driven largely by tax revenues increasing faster than costs. Again, if we focus on costs in real terms, the subject of current policy preoccupations, we found that such costs rose (albeit unsteadily) over the whole period, ending about 50 per cent higher in 2008-09 than in 1980-81.
Exhibit C. Civil Service Paybill Costs.
Civil service employment costs have been a central target of cost-cutters for many decades. But official definitions keep changing to an extent that only careful detective work can produce a consistent data series over time. We found that while Civil Service staff numbers fell by about 35 % over this period, the cost of employing the Civil Service remained about the same in real terms, though the civil service paybill fell significantly relative to total government spending. Policy makers should therefore not assume that cutting civil service headcount will automatically lead to savings in paybill.
Scorecarding these Results
A way to ‘scorecard’ these results, in the light of current policy preoccupations with absolute cost cutting, is to give +2 for each fall (>5%) in absolute costs; −2 for each rise (>5%) in such costs; +1 for each fall in costs relative to TME/yield; and −1 for each rise in such costs. If we weight the three exhibits (running costs, tax collection costs and civil service pay) equally and ignore changes of less than 5% (as arguably within the range of measurement error). That would mean a top possible score of 9 and a bottom possible score of −9. The whole three decades considered here (1980-2009) yields the undramatic overall score of −1. Each of the individual decades was similarly unimpressive, with the least impressive performance in the 1980s under Margaret Thatcher (scoring −3).
The only 5-year period that scored the maximum on every indicator (a ‘perfect 9’) was the last 5 years of John Major’s premiership from 1992 to 1997, as shown below.
What can we draw from this analysis?
Looking back at over three decades of managerial changes and efficiency drives in UK central government, there is no clear example of administrative cost-cutting that comes close to what current policy-makers are aiming for. More specifically:
- Cuts in civil service staff numbers do not always mean equivalent cuts in staffing costs
- Cuts in staffing costs do not always mean equivalent cuts in overall running costs
- Relative costs tend to fall when overall spending or tax revenue is sharply rising – leading to the ironic conclusion (unhelpful for current policy-makers) that the “best” way to cut relative costs is to spend (or tax) more
- Government and Parliament cannot practicably ascertain whether performance is improving or otherwise over time when the numbers keep changing in a way that makes over-time comparison as hard and costly as possible.
- Even the “perfect 9” scored in the late John Major period yielded less than one fifth of the 2010 to 2014 UK administrative cost saving target of 34 per cent (though the paybill cuts came close to the 2011-15 Scottish cost saving plan).
This study was funded by the Leverhulme Trust as part of the project “Yesterday’s Tomorrows: What Happened to the Future of Government?”. More details at http://xgov.politics.ox.ac.uk/
Note: This article gives the views of the authors, and not the position of the British Politics and Policy blog, nor of the London School of Economics. Please read our comments policy before posting.
Christopher Hood (www.christopherhood.net), Gladstone Professor of Government and Fellow of All Souls College Oxford, was Director of the ESRC Public Services research programme 2004-2010.
Ruth Dixon has worked at the Department of Politics and International Relations at Oxford since 2006.
Christopher Hood and Ruth Dixon have jointly published several papers, including ‘Rating the Rankings’ (International Public Management Journal, winner of the June Pallot prize for best article in that journal in 2008), ‘Testing Times’ (with Will Jennings) European Journal of Political Research 2009, ‘No-Brainer or No-Gainer’ Journal of Public Administration Research and Theory 2010.


Actually cutting administrative costs for some parties is quite favorable. because it certainly will impact on the bureaucracy more easily and will certainly make a service is becoming increasingly competitive. But, on the other hand it will make a reduction in government revenue, particularly tax increases for the financing structure. certainly needs a very interesting formula associated with this.