 According to one measure from the government figures released today, an extra 300,000 children have fallen below the poverty line since last year. However, since there are various measures and methods for evaluating poverty, different pictures can be painted. Conor Darcy notes that though the absolute low income figures are concerning as is in-work poverty, the combined measures muddy the waters somewhat. But taken together, the report does suggest there’s still lots of work to be done to stem the rise of poverty.
The latest figures from the Households Below Average Income report were released this morning, giving us an updated picture of UK poverty. As it includes a range of numbers and methods of measuring poverty, we need to look at them all to get a handle on what they’re telling us. These measures are often contested and, as we’ll see, can seem confusing and contradictory. The graph below dealing with poverty among children is a good place to start though.
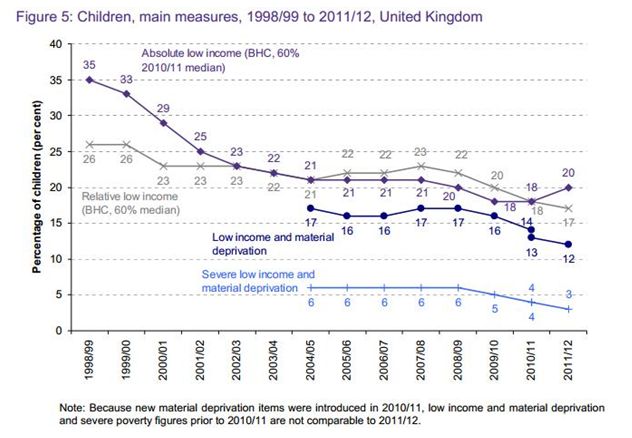
The headline figure is the 2 per cent rise in children below the (purple) absolute low income line. This considers household incomes before housing costs and is set at 60 per cent of the 2010/11 median wage (the middle income of all earners which is more representative than an average). Using the 2010/11 median income gives us a baseline that doesn’t depend on how everyone else has fared this year.
What that means is an extra 300,000 children have fallen below this line since last year, a worrying development and the biggest jump for quite some time. Unfortunately, recent IFS analysis suggests this trend is likely to continue with absolute child poverty projected to stand at 27.2 per cent by 2020/21, compared to the 5 per cent target. It should be noted though that the way in which inflation is tracked – using the Retail Price Index (RPI) rather than the Consumer Price Index (CPI) – means the numbers in poverty will be larger since RPI tends to give a higher inflation rate than CPI.
A different view emerges from the (grey) relative low income measure, which looks at the number of children below 60 per cent of the median income for 2011/12. While this acknowledges that needs are relative to the rest of society, it can fail to register changes in living standards for better or for worse. This has decreased for the fourth year in a row which is partially explained by cuts to benefits and the fall in the median income, down £13 from last year to £427 which represents the first year-on-year decline in 50 years. If everyone’s income is falling then fewer people will find themselves classed as in poverty by this measure.
The bottom two lines combine material deprivation (whether you can afford the “essentials” as agreed by public consultation) with low income (below 70 per cent of median income) and severe low income (below 60 per cent of median income). Both have fallen by 1 per cent which is a good thing though exactly how much of a good thing is unclear. Since the deprivation questions asked have changed, it’s hard to get an exact gauge on how notable this and what it means in reality. These reductions are not statistically significant whereas the respective rise and fall in absolute and relative poverty are.
That’s the picture for children but what about the rest?
- Across the entire population, an additional 900,000 people are now in absolute low income poverty.
- Working age poverty has risen by 2 per cent meaning 6.1m people find themselves in absolute poverty.
- In-work poverty remains an issue, with some sub-groups like couples with only one full-time worker experiencing an increased likelihood of being in poverty. Two in three children in poverty live in households where at least one person works.
- Poverty among pensioners is up 1 per cent to 15 per cent (after housing costs because pensioners are more likely to own their own homes).
What’s the overall verdict then? Mixed. The absolute low income figures are concerning as is in-work poverty but the combined measures muddy the waters somewhat. The different picture painted by the various measures is likely to add further fuel to debate on the best measure of poverty. As we noted in our response to the DWP’s recent consultation, no single measure can tell the whole story but taken together, this report does suggest there’s still lots of work to be done to stem the rise of poverty. With April’s welfare reforms not included and stagnant wages, it’s hard to be optimistic about a reversal of these trends any time soon.
Note: This article gives the views of the author, and not the position of the British Politics and Policy blog, nor of the London School of Economics. Please read our comments policy before posting.
Conor Darcy is a policy and research assistant, working on the Joseph Rowntree Foundation’s anti-poverty strategy for the UK.


1 Comments