 Crime mapping is not new in the UK – so does the new Home Office’s online crime map go one better than those that went before? Daniel Bear looks at the motivation behind the next iteration of local crime maps and finds that while government seeks to encourage people to hold their local police forces to account, they do not give nearly enough information to citizens to allow them to do so.
Three men shuffle slowly between the shadows of the alley and the pavement’s edge in the freezing pre-dawn quiet. Hands in pockets, they’re waiting for the clearly marked police car 40 meters down the road to leave. Their business of selling crack cocaine is on pause for the moment, and the several grim faced addicts sulking nearby may go elsewhere if they have to wait much longer. PC Tom isn’t going to search the men, nor even get out of the car. He knows they don’t actually have the crack on them. His only goal is to keep them from selling their drugs for a few minutes. Sooner than he’d like the radio comes alive with an ‘I’ graded call about a domestic incident in progress, and PC Tom peels away from the curb with the engine racing and siren blaring. According to the Home Secretary’s new crime map, nothing untoward happened on that street because no reports were filed, no suspects were arrested, no police action took place. But scholars, politicians, and the public have all known for some time that official crime figures aren’t the full story of crime in Britain. It’s a shame the Home Office didn’t get that memo.
You wouldn’t know it from reading a newspaper, but we’re actually living in an era of falling crime and relative safety, with violent crime down by nearly half since 1995 in the UK. And these numbers aren’t solely based on police figures, but are also backed up by the British Crime Survey (BCS). The BCS asks people about the crime they experience, not just the crimes they report, and there can be a very large gap between the two This remarkable drop in crime is not just a British phenomenon, with places like New York City experiencing an 82 per cent drop in homicides since 1990.
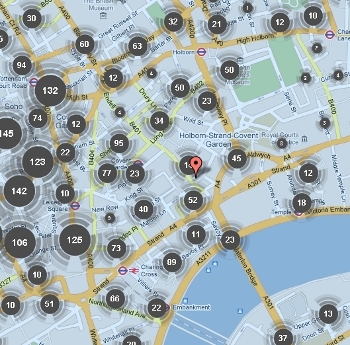
Why then does the government’s recently launched crime map show only the crimes reported to the police in the last month, and doesn’t highlight this glorious downward trend in crime? I believe Murray Lee says it best: “Crime maps are wonderfully seductive. They reduce complex social phenomena to a limited number of dots or shading on a cartographic representation of space”. The Home Office already had a borough level crime map showing trends in reported crimes (a feature the new map lacks), alongside the Metropolitan Police Service’s ward based crime maps that identified your local Safer Neighbourhood Team (SNT) (the only useful tool included in the new map). The new map differs only in its new ability to look at crime down to the street level, but even then the government has only marked crime with a rough approximation to ostensibly protect the privacy of victims.
In an extraordinary transgression against basic criminal justice statistics, the new map lumps together criminal damage, shoplifting, drugs offences, and sexual offences under an auspicious section called, ‘Other Crime’. Certainly the community should know if the aqua coloured numbers hovering over their street represent several rapes or instead just several broken car windows. To equate the two in a public document is oversimplification at the expense of community the map aims to serve. Even with these shortcomings, these maps are useful tools to some degree as they at least create access to knowledge and information. A healthy democracy thrives on such knowledge.
Policing Minister Nick Herbert believes that by giving people this very rudimentary overview, “…we are giving people the information and power to hold their local forces to account and ensure that crime in their neighbourhood is driven down.” In other words, shifting the onus onto the citizenry to be engaged in the deployment of services aimed at protecting them. Unfortunately Mr. Herbert has miscalculated the power his new initiative actually gives people.
For whilst it is true that knowledge and information are some of the most important foundation stones of a democracy, one cannot empower us to hold the police service to account by merely telling us the number of crimes occurring. The missing piece in Mr. Herberts plan is to provide the information about what the police are actually doing. The Government needs to provide the basic information that puts context into otherwise dire looking numbers. What is the crime rate per population? What are the year-on-year trends? Are the crime numbers high because someone is breaking into parked cars or because the police handed out ten cannabis warning slips to a group of young people smoking in the park last weekend? This information isn’t just useful, it’s absolutely necessary to give the map any practical value.
Without such information the map is a gloss-over of the bigger issues in criminal justice policy. The Coalition Government is slashing the programmes that provide pathways away from criminal behaviour for many young people. The engagement with positive extracurricular activities and role models is what in the long term truly impacts crime numbers. The comments by Ms. May and Mr. Herbert seem to imply that crime is the result of police inadequacy, and that isn’t always so. As a Government, you cannot ask to people to implore the police to do more when you don’t show what it is they’re doing, and you’re cutting the programs that prevent crime in the first place.
This new crime map is certainly a welcome start towards more open and accountable government, but we can’t simply assume that a flood of data is a good thing unto itself. Paired with more robust information, mechanisms to support community involvement, and a strategic plan to make the data a part of real growth in accountably of the criminal justice, this could be a great tool. As it is though, it’s just a £300,000 gimmick.
Click here to respond to this post.
Please read our comments policy before posting.


