Affluence at top US private universities has had profound consequences on tertiary education and increased the competitive challenges to public schools in the UK and US. Looking at the London School of Economics, Dennis Shen explores the impact of wealth inequality in education.
The London School of Economics is a university with a very public mission, created on a vision to serve the betterment of society. The Fabian Society – home to LSE architects Sidney and Beatrice Webb, George Bernard Shaw and Graham Wallas – hoped that the new research institution would improve lives in the UK to achieve a more just society. It has been this founding principle that has made the LSE a special place for so many.
But much has evolved in the world around the school, and new challenges have developed. Income inequality has become a defining issue in Western countries since the 2008 financial crisis, and new kinds of inequality have shaped in higher education in past decades that impact public universities like the LSE very directly. This article overviews the consequences that wealth inequality in tertiary education has had on public UK and US universities in an era of affluent private US institutions (e.g. the US Ivy League universities). Wealth at top US private schools has had profound consequences and forced operational adaptation in public UK schools in order to compete with more limited resources. In 2010, the LSE publicly examined the option of privatisation to better compete globally. But this option critically conflicted with the school’s founding values, met considerable pushback, and exhibited the current dilemma with the internationalisation of competition and redistribution of wealth to private entities.
Wealth Inequality in Higher Education and Its Roots
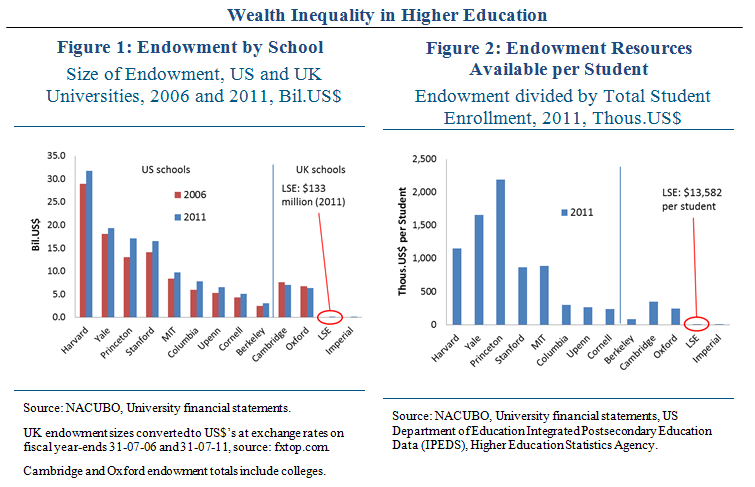
Figure 1 shows endowment funds (in billions of US dollars) for nine leading US universities and four British institutions in 2011. Of the schools shown, only UC Berkeley and the four UK schools are publicly owned. In 2011, LSE’s endowment amounted to $133 million (£82 million), an increase from $96 million (£51 million) in 2006. This compares with $31.7 billion owned by the Harvard Management Company and $19.3 billion held by Yale University. To make this disparity in dimensions apparent, Harvard’s endowment is presently 238x the amount available to the London School of Economics. Figure 2 makes a per capita adjustment since LSE has a smaller student body (9,805 students against 27,576 at Harvard). This adjustment shows that the resources disadvantage remains very significant – at $13,582 per student at LSE compared with $1.15 million available per student at Harvard. It does not require much a justification to explain – if such a wealth disparity exists – why schools on the wrong end will over time find it more difficult to compete.
How did endowments at some private universities accumulate to present day sizes when such wealth did not once exist in these academic institutions? Where there was once relative equality in finances between public and private universities in the 1970s, there has since been a steep build-up at top private university endowment funds. Here, at least two causes are important:
1) A high risk, high return investment mandate pursued by elite private university funds since the 1970s that has created wealth from wealth (a “compounding” effect)
2) A cultural and institutional difference between private and public school systems and societies that has influenced the scale of fundraising and new donations to schools (a “flow” effect).
In the early 1970s, the investment objectives of US endowment trustees changed from securing income to maximising long-term total return – a discrete but critical alteration. Implemented in the bull markets of the 1980s, 90s and 00s, a new profit-seeking motive (that invested private school funds into alternative strategies like private equity, hedge funds and venture capital instead of previous conservative money markets and bond funds) yielded nominal returns in excess of 10% per year. As standard operating procedure is to spend approximately 4.5% of endowment funds on current operations annually, a fund return of 10% quintuples a fund’s size (at 10% – 4.5% = 5.5% annual enlargement) within thirty years, even without seeking new gifts. This was supported by the non-profit status of many private universities, which exempted funds from capital gains taxes. Since the 1970s, large capital gains on investments (the “compounding” effect) have superseded new fundraising as the main vehicle for growth. Harvard Management Company increased its endowment from $4.7 billion in 1990 to $30.4 billion by 2012.
Cultural and institutional differences also play an important role when it comes to why endowment fortunes have increased in some, but not in others. The very fact that many top schools in the US are private whereas the university system in the UK and Europe is dominantly public makes a considerable difference to how people perceive responsibility to donate. Madeleine Lee and Linn Stabbetorp, graduates from LSE’s Institute of Public Affairs, point to critical facets in their home countries of Germany and Norway in which the common view is that universities not be privately funded – in this viewpoint, the thought of private contribution can be a challenge; instead, schools need remain public and unbiased. But since a faith in public goods drives a dependence on the state for university financing, times of austerity may prove difficult for public universities.
The Impact on Operating Income
What kind of impact has wealth inequality made on the annual operating budgets of top universities? And how has this changed the landscape of competition in education? To answer this question, Figure 3 compares the operating incomes of LSE and Harvard in the 2011-12 fiscal year, divided by income source – these numbers are publicly available in annual reports. I adjust for the total student enrolment at each university to provide the annual school income available to spend per student.
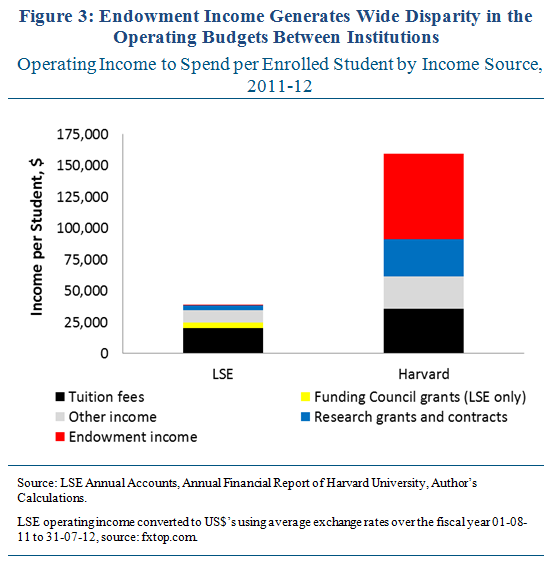
Figure 3 shows that in 2011-12, the resources available to Harvard were notably more than that to the LSE. Harvard’s endowment income (in the large red bar), which represents the 4.5% of the $30 billion endowment it takes out each year, is more than each of LSE’s income sources added up. And so, Harvard’s investments create much of its current income. Of LSE’s total 2011-12 income of £244 million (equal to $39,264 available per student) adjusting for scholarship expenditures, 52% of this came from student fees (in the black bar), and most of this from international students. Only 2% of its operating income is from its endowment. And what about public sector funds from the UK government? After the recent cuts to education, the Higher Education Funding Council for England (HEFCE) Grant from the Department of Business, Innovation and Skills amounts to £28 million ($4,504 per student) or just 11% of LSE’s income (its yellow bar in the chart shows up as only a sliver). LSE’s income also includes “research grants and contracts” (sponsored by research councils, government departments, the European Commission) that make up 9% of total income and “other income” (residences and catering, consultancy services, etc.) that make up £60 million or 25% of total income (grey bar).
Of Harvard’s total 2011-12 revenues of $4.4 billion before scholarships, student fees (excluding scholarships) account for $978 million ($35,478 per student) or 22% of the total. A very significant 43% of Harvard’s revenue worth $1.9 billion (or $67,834 annually per student) is sourced from its endowment and gifts for current use. Another 19% of its income worth $832 million comes from research contracts (in the blue bar) sponsored by government and private sources.
Effects on Allocation of Operating Expenses
So, wealth from donations and endowments play an important part in the disparity of annual budgets available to universities. However, the question of whether such significant income in some higher education institutions is a positive thing is a much harder question to answer. Income to hire more faculty and decrease class sizes draw universal applause. Wealth allows the very financial aid for lower-income students to have an equal chance. And students at top private universities continue to provide strong marks on their experience, graduate at high rates and excel in work life due in part to their education.
However, this is not the complete story. The trouble is that though wealth has bettered the experiences at some private colleges, the inequality in the distribution has also had adverse impacts on many public universities. And with 72% of college students in the US attending public institutions and the vast majority in the UK, such an end-result is not without deserved attention.
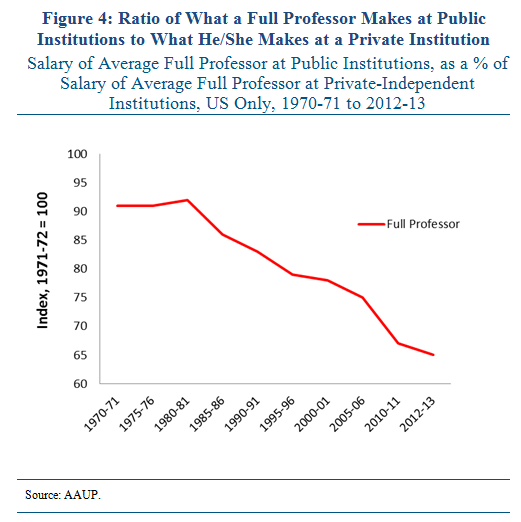
Large endowments have been the resource to offer considerable pay packages, and have been responsible for “hiring raids” on public schools. According to American Association of University Professors (AAUP) data (shown in Figure 4), a full professor at a public US doctoral university in 1970-71 could have expected a salary equal to 91% of what a colleague at a comparable private university earns. But by 2012-13, the proportion for a public university professor’s pay had declined to only 65% of his/her peers at private schools. In other words, working at a private university now pays a very significant premium. And the further you look into the future, the more troubling this becomes.
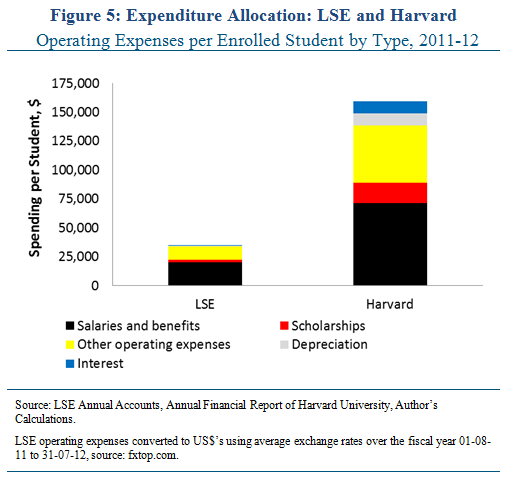
Figure 5 compares the operating expenditures of LSE and Harvard in the 2011-12 fiscal year, divided by the type of expenditure (and adjusted for student enrolment).
In 2011-12, LSE allocated 57% of total expenditures, worth £126 million on staff costs (salaries and benefits). The remainder includes £14 million (6% of expenditures) spent on scholarships and £85 million (32% of expenditures, $11,369 per student) on “other operating costs” that includes facilities, residences, library and IT, departmental requirements and equipment.
As displayed in Figure 5, Harvard can spend more per student due to its wealth and income. Of Harvard’s $4.4 billion in 2011-12 expenditures (including scholarships), $1.9 billion was allocated to salaries, wages and benefits. And even this $1.9 billion only makes up 45% of the total pie. The remainder – 55% of the budget – can be spent on scholarships (in the orange bar) that amounted to $486 million (equal to $17,624 per student), and other operating costs (in the yellow bar), which make up 31% of total expenses ($1.4 billion or $49,406 per student) and include capital projects like the expansion and renovation of the Harvard art museum and commencement on a Science Centre Plaza.
Next Steps
As an important issue is in the limited endowment income, then what can be done to raise alumni propensity to donate? Next, how do public schools invest the endowment funds? There is a moral question in how non-profit institutions invest funds – should they be invested with social purpose and preservation of capital in-mind, or should it be done for-profit to best compete?
This leads to an alternative way to look at the question – what options are there in the policy space. Is there a place for policy to regulate the role of money in higher education? Instead of providing tax exemptions to university endowments, can capital gains taxes be implemented on returns and what of the endowment wealth – is there a channel to more equitably distribute the resources? If inequality in society is responded to with progressive taxation and redistribution, could not inequality in education be responded to similarly?
Note: This article gives the views of the author, and not the position of the British Politics and Policy blog, nor of the London School of Economics. Please read our comments policy before posting.


1 Comments