Publication of the 2014 GCSE results has highlighted a worrying decline in academic performance by poorer children, find Ruth Lupton and Stephanie Thomson. Understanding what has happened here needs serious attention.
The release of the 2014 GCSE results, showing a fall in overall achievement and a doubling of the number of schools not meeting the government’s floor target, was met by arguments over the value of vocational qualifications and complaints about league tables and government’s frequent tinkering with them. What seems to have attracted less attention is the trend of lower attainment among certain groups of disadvantaged students, and a re-opening of the socio-economic gap. This short piece explains the story behind the key results.
We start with the DfE’s headline numbers. Looking just at state-funded schools, overall attainment at 5 A*-C has fallen from 83.0 per cent in 2013 to 65.5 per cent in 2014. Attainment of students eligible for Free School Meals (FSM) has fallen much more than for their non-FSM peers, widening the gap between the two groups from 16 percentage points in 2013 to 28 in 2014. When English and maths are included, the trends are much less marked, with overall attainment falling from 60.6 per cent to 56.6 per cent and the gap widening only very slightly from 26.7 to 27 percentage points.
The main explanation is a set of changes to the counting rules. In 2014, some 3,000 fewer vocational qualifications (VQs) were removed from the performance tables altogether. Remaining VQs only counted for one GCSE each (previously some counted for up to four), and there was a limit of two non-GCSE qualifications per pupil. Furthermore only the result of student’s first attempt at a qualification was counted, to deter multiple entries aimed at boosting grades. Secretary of State Nicky Morgan said that the changes had resulted in “pupils spending more time in the classroom not constantly sitting exams, and more children are taking core academic subjects that will help them to succeed in work and study”.
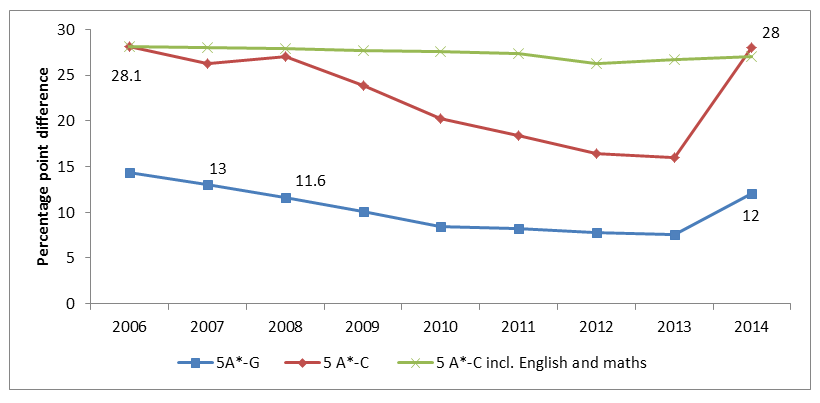
Figure 1 shows the gaps between FSM and non-FSM students since 2006. On the five A*-C measure, the gap has now returned to its 2006 level, suggesting that all the gains made since then have been due to students taking more VQs or ones with higher equivalent value, or having several attempts at an examination. Certain groups of students seem to have benefited particularly from those practices. In 2014, at the 5 A*-C level, the performance of white boys on FSM was down 29.2 percentage points on 2013 (from 64.8 per cent to 35.6 per cent), and children with Special Educational Needs on FSM down 32.8 percentage points (from 49.4 per cent to 16.6 per cent. The performance of FSM students has fallen less in London than in other parts of the country.
Figure 1: Percentage point gap between FSM students and non-FSM students at KS4
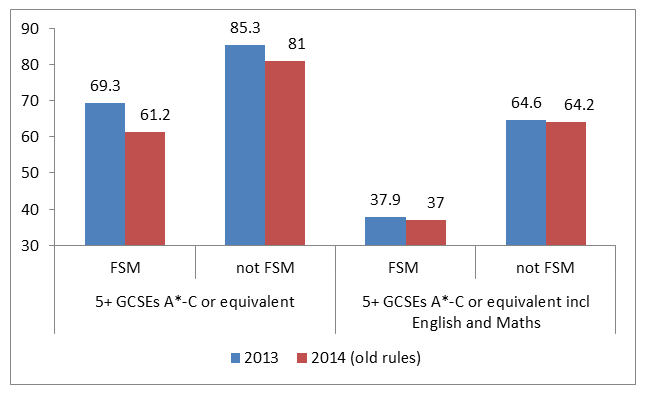
But not all of the trends are accounted for by the rule changes. DfE has also produced data showing the 2014 results as they would have been if all qualifications and entries had been counted in the same way as previously. In other words, the real changes in what students have achieved. These data show a fall in overall attainment of 4.8 percentage points at the 5 A*- C level and 0.3 percentage points including English and maths. At 5 A*-C, the fall is more pronounced for FSM students – 8.1 percentage points. And the gap between FSM and non FSM pupils has widened – from 16 percentage points in 2013 to 19.8 in 2014. Including English and maths, there has been less change (Figure 2). Unfortunately DfE has not yet published these results for different sub groups of people or areas.
Figure 2: Percentage Achieving Five or more GCSE 2013 and 2014 (under same counting rules)
What is happening here? Given all the effort put into the Pupil Premium, we would expect gaps to be narrowing, not widening. One explanation is that school practices have changed. Schools may be encouraging more academic subjects in general. Rather than letting students sit an examination several times and risking a low score on the first attempt, they may only be entering them at the last possible opportunity. New ‘discounting’ rules may have had an effect. These mean that where there is overlap in curriculum between a GCSE and a VQ, only one qualification will count in the performance tables. This might also be affecting examination entry strategies. Financial pressures on low income families may also be a factor – recent research reports rising poverty and hardship after 2013.
Another explanation, though, is the changes to GCSE curriculum and assessment that took effect in 2014. These were the first of the reformed GCSEs assessed only by examinations at the end of the course, not on a modular basis. They were also the first in which speaking and listening made no contribution to the GCSE English grade, although Ofqual has tried to adjust for this using a ‘comparable outcomes’ approach.
Whatever the main factors, the changes have had most effect for students at the 5 A*-C threshold – lower attaining students who would have achieved this level with the previous assessment mode or by taking a vocational equivalent, but who have not been able to do so under the new system. These students have actually achieved less. And it is the Free School Meal students in this group who seem to have been most substantially affected.
This change is not an artefact of counting rules but a real and worrying dip in attainment for the very students who are most at risk of not making successful post-school transitions and upon whom the government’s Pupil Premium is presumably focused. Understanding what has happened here needs serious attention in the weeks and months to come.
Note: This article was originally published on the Manchester Policy Blogs and gives the views of the authors, and not the position of the British Politics and Policy blog, nor of the London School of Economics. Please read our comments policy before posting.
Ruth Lupton is a Professor of Education at the University of Manchester and an associate and former Deputy Director of the Centre for Analysis of Social Exclusion at LSE. Stephanie Thomson is Research Associate at the University of Manchester.