 Posted by Patrick Dunleavy.
Latest Poll Information for 21 April
| Party | Sky News Poll Tracking | LSE Poll Tracking |
|---|---|---|
| Per cent | Per cent | |
| Last Change | 21 April | 21 April |
| Labour | 28 | 26 |
| Conservatives | 33 | 32 |
| Liberal Democrats | 28 | 31 |
| Other Parties | 11 | 11 |
| Tory Lead over Labour | +5 | +6 |
With five very current polls our measure shows a high level of agreement – with Labour steadying at a low level – perhaps reflecting only some temporary damage from the airports closures, or perhaps a harbinger of more serious problems to come. There is the narrowest of leads for the Conservatives over the Liberal Democrats. (Meanwhile the Sky News poll tracker still includes one poll pre-dating the Clegg surge – an old MORI poll, that is now completely out of date and drags down the Liberal Democrat score there).
With the top three parties running pretty close to each other now, it can be difficult reading the polls with ‘two horse race’ assumptions in mind. Consequently media commentators tend to take refuge in the argument that the polls are ‘all over the place’ – perhaps a journalist short-hand for saying ‘I can’t understand what’s happening’.
In a three-way competition it can be very helpful to think in more spatial terms. So in the diagram below I picture all the parties support at once in a triangle shape, to help[ keep movements in perspective. Here each of the top 3 parties ‘owns’ one point of the triangle as its home-ground – and the closer an outcome is to each party’s home-ground, the more votes that party gets. However, because the Other parties are still running well and look certain to get around 10 per cent of the vote, we have set each home-ground point to mean that the party in question gets 90 per cent of the votes (instead of 100 per cent).
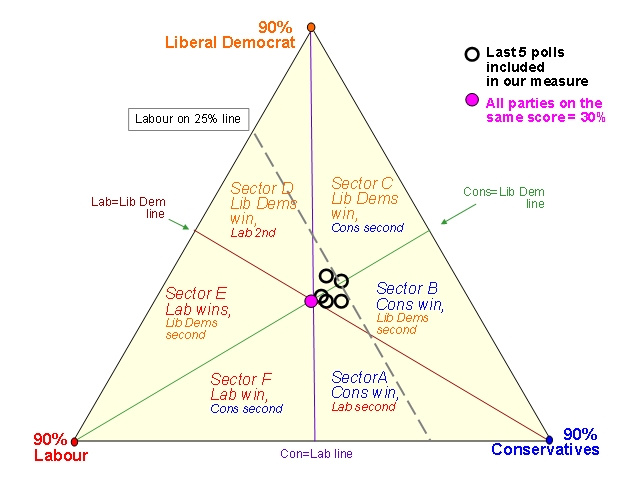
In turn that means that the very centre of the triangle (the pink blob) is the point where all three of the top parties get the same votes share, that is 30 per cent each (once we have allowed for the 10 per cent going to the Other parties). The lines running from each point of the triangle through the mid point show where two parties get the same score (as labeled on the diagram).
These lines divide the whole triangle into six sectors, labeled A to F. In the two sectors closest to the Conservative home ground on the bottom right (A and B), they win the largest popular vote. Labour wins in the two sectors on the bottom left (E and F), and the Liberal Democrats win in the two top sectors (C and D).
So where are the polls? The hollow black circles show that they are all straddling across the boundary between sectors B and C (with either the Conservatives or the Liberal Democrats getting most votes), with Labour scores spreading between 26 and 28 per cent in third. The polls are not as convergent as they were yesterday, but still they are reasonably close together. (I should add that this diagram tends to visually ‘squash’ together results the closer we are to all three parties getting the same score, so that these results are not quite as close as they seem here).
It should be clear that if the Clegg surge dies out we could still easily move downwards, back to sector A with the Conservatives running first and Labour second, as most commentators expect. However, a slanting down movement into sector B (moving towards the Tory homeground) would pose problems for Labour, who might be tipped into third place.
If the Liberal Democrat surge were to continue to grow then the polls might move upwards into sector C, but if the Lab support stays above 25 per cent then not very far. Labour’s problems would grow very rapidly, however, if the movement was straight upwards into Sector C, forcing their vote below a quarter.
But bear in mind that with all three parties still close to the even-stevens point, very small movements can produce a result in any of the four triangle sectors on the right (sectors A and B) and top (sectors C and perhaps even D here). So there is still a lot to play for in terms of votes shares – and everything to play for in terms of the parties’ MPs as votes translate into seats.


There are trends in UK elections no one is talking about, the big one is the ‘missing voters’ 1997 was not only in part a swing from Conservatives to Labour, but also an election were I estimate at least 1/3 of Conservative voters stayed at home.
http://bciconcoclast.blogspot.com/2010/04/so-where-is-that-swing-looking-at-1997.html
Applying this thinking to the current election could mean some big surprises on May 6th
Canada is a place the UK should look for how elections may play out and how parliaments might work. We are the only major country that also has a Westminster Parliament and first past the post electoral system. Our big difference is that we have been a federation since the start and therefore have not one, but 11 parliaments, one national and 10 provincial.
Not only can we offer you a lens to view extraordinary shifts in voter support in elections, we can also show what can happen with hung parliaments.
Since 1945 you have had a two party moderately stable political scene. You have had 17 elections since 1945 and only one has resulted in a hung parliament. 2010 may be the second.
In the same time period Canada has had 21 elections of which 9 have ended in hung parliaments.
From 1957 to 1984, no two Canadian elections in a row resulted in majority governments.
Canada has had a hung parliament now for six years. It has not been pretty at times, but I will point out that no other G7 country has weathered the recession as well as Canada and the government has not done so by racking up a huge new debt. Things get done in a hung parliament.
1962 to 1968 Canada was also under hung parliaments, during this time much many big and important legislative changes happened in Canada.
There is a lot to learned from us over here if your political landscape truly is changing.
Hi all,
I’ve just been on an election calculator
(I don’t know how accurate this is but…)
If
LD = 33.5%
Con = 33%
Lab = 29%
then we would get…..
National Prediction: LAB short 67 of majority
Lab = 259 MPs
Con = 235 MPs
LD = 124 MPs
Its great to live in a democracy isn’t it!
Great diagram, thank you. Keep up the excellent posts!
Thanks very much for this comment Bernard and the link to your thought-provoking blog. We will be posting a blog on our site later today, from Anne White who analyses the lessons for UK politics from the Canadian experience of holding three elections in a row that have generated hung Parliaments – which is little known as yet in the UK.
It is time for people in the UK to look to some election results in Canada. The traditional thinking of swing in the UK is not working. There have been a number of elections federally and provincially in Canada that have had dramatic changes in party fortunes.
http://bciconcoclast.blogspot.com/2010/04/lessons-uk-pundits-can-learn-from.html
Thought is going to why some of these dramatic election results happen from time to time in Canada. Much has to do with people choosing to stay home because they are not willing to vote for their party and will not for anyone else.
Applying some of this thinking to the UK election and the potential results are dramatic.
Yes, I second Luke, great diagram. I’m adding LSEelectionblog to my #ukelection twitter list: http://twitter.com/MariamCook/uk-election-2010
Great diagram! Will repost..