
The last census showed significant population growth across British cities after decades of stagnation and decline. Using visualisations from a research project investigating relationships between urban form and dynamics in British cities, Duncan A. Smith finds that, on the whole, there is a distinct spatial pattern of population change that is surprisingly consistent across cities. This data review prompts a series of further questions regarding the socioeconomic and property market processes inherent in this urban change, and what future city centres and suburbs will be like.
The first decade of the 21st century marked a major change in population dynamics for British cities. After urban stagnation and decline being the dominant trend in the second half of the 20th century, significant population growth across British cities was recorded in the 2011 census. This growth is not limited to London and the South East, but can be seen in most regions of the country, and is evident in settlements at a range of scales.
Furthermore there is a distinct spatial pattern of population change that is surprisingly consistent across cities. City centres have intensified with increasing densities and brownfield regeneration, in line with the thrust of planning policy following the Urban Task Force Report of 1999. Meanwhile suburban areas are generally static or even in decline in many cases.
To help explore this spatial variation we use visualisations from a research project investigating relationships between urban form and dynamics in British cities. The Luminocity site is an interactive map of Great Britain combining activity and built-form data, seeking to highlight patterns of urban intensification and redevelopment. The site uses datasets made available through UK open data initiatives, and includes data for Great Britain (not yet for Northern Ireland).
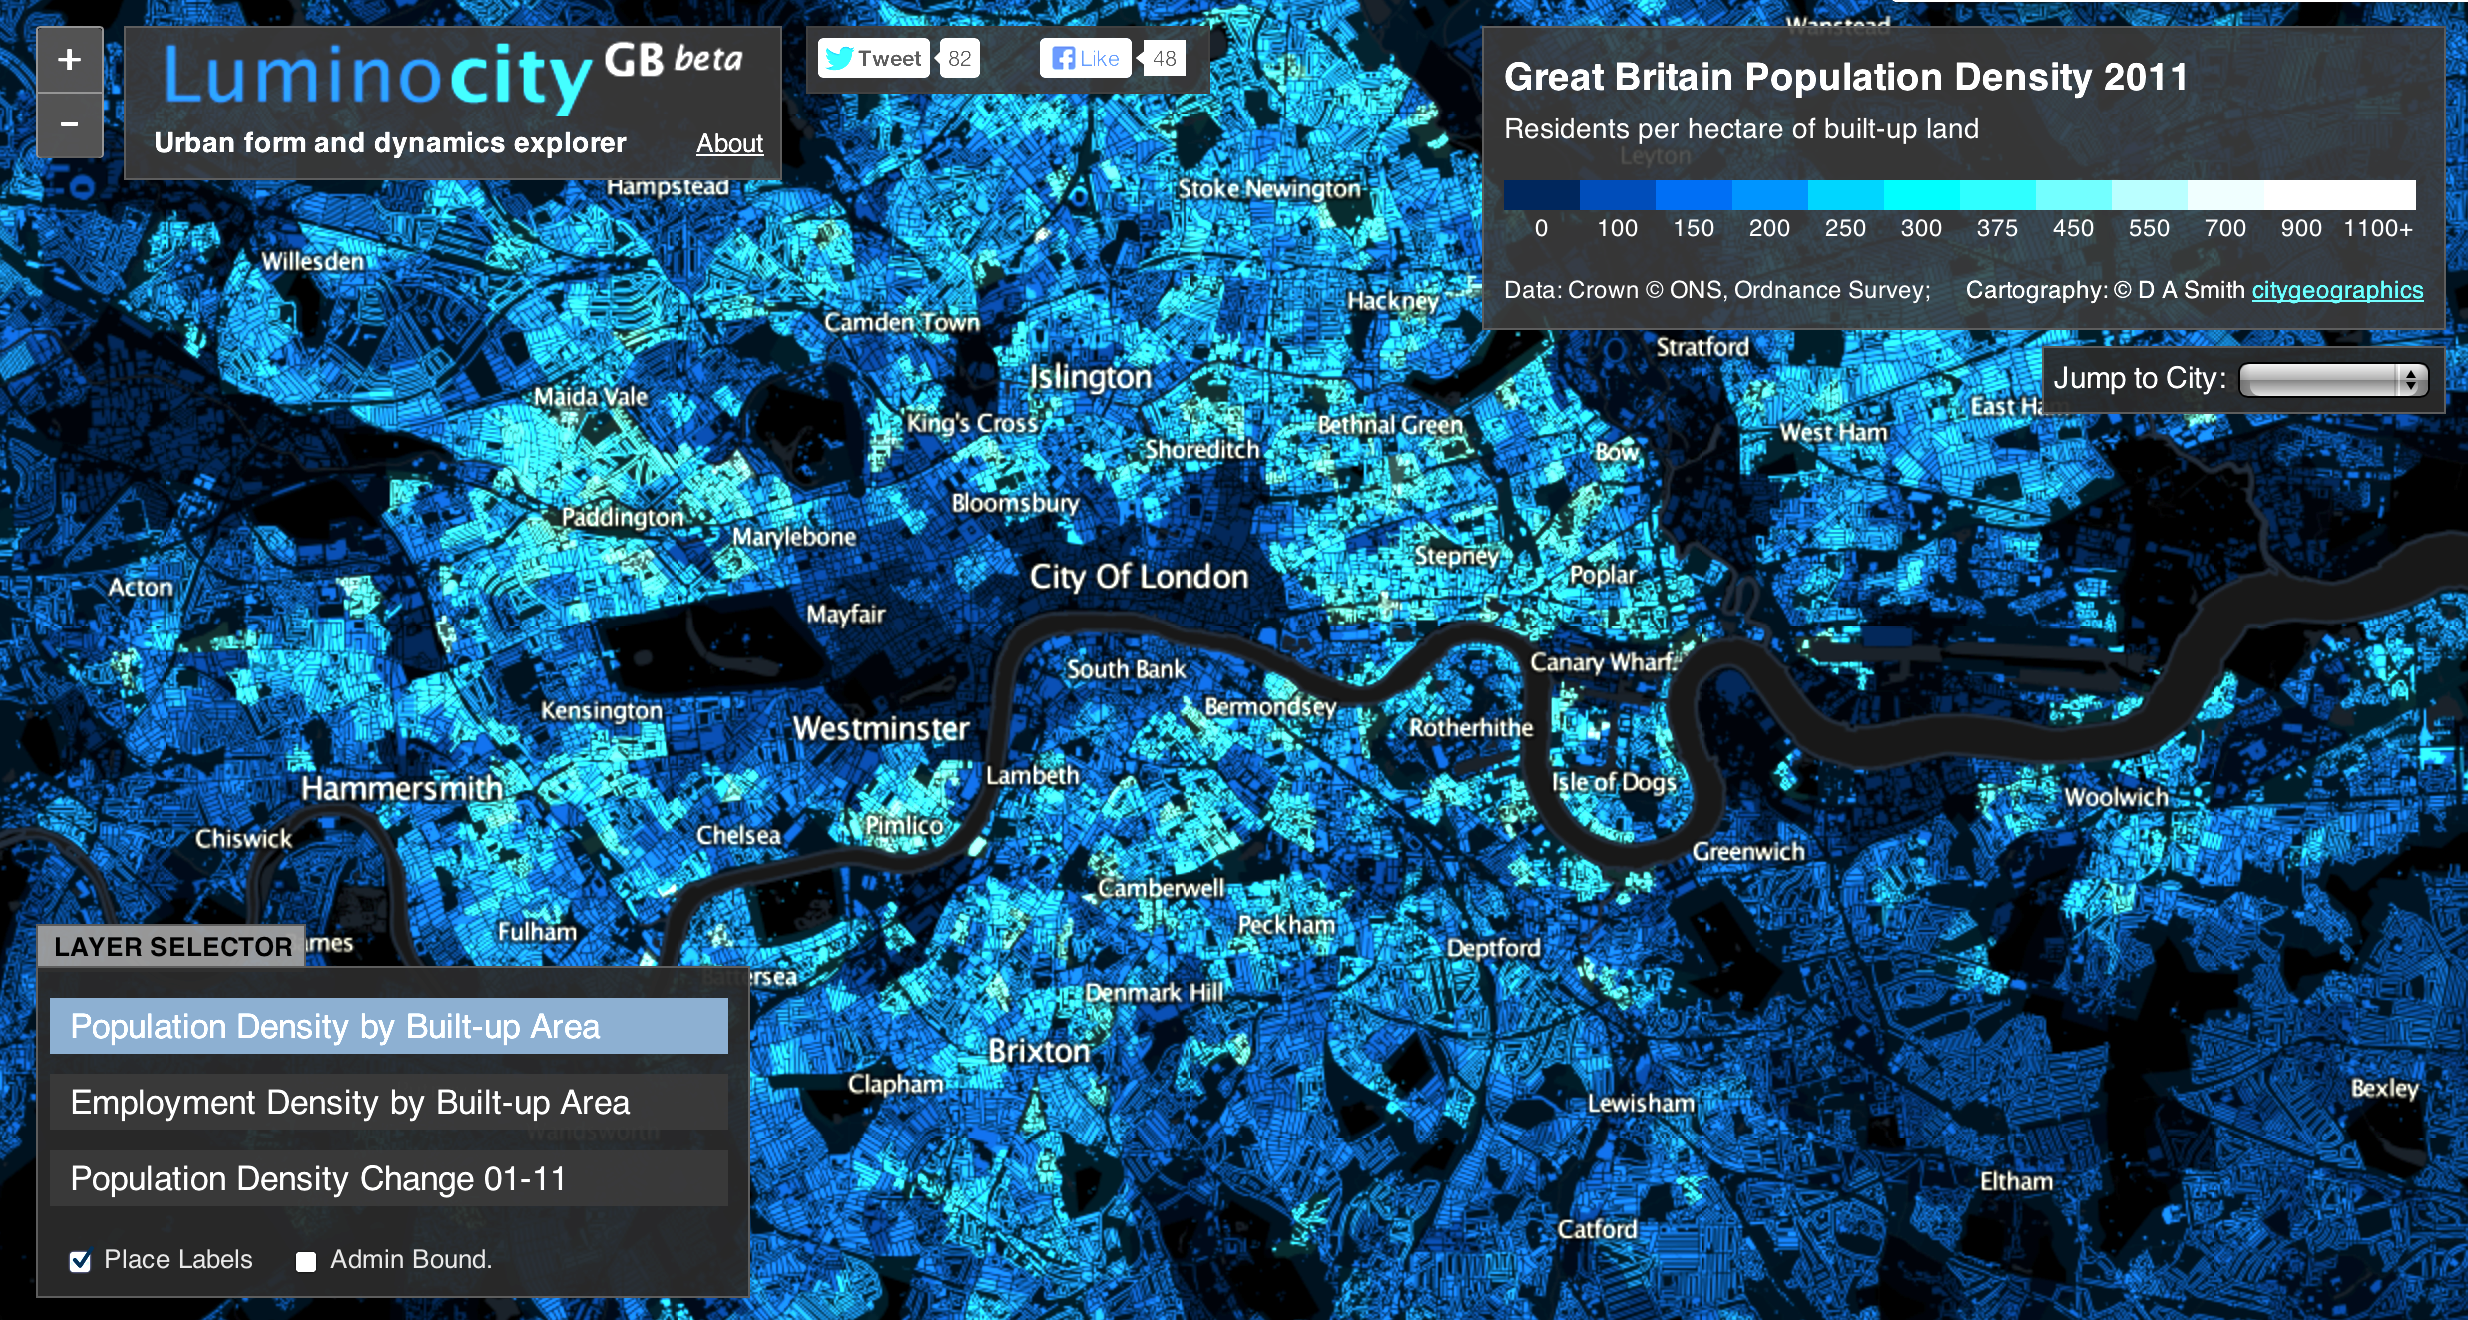
London unsurprisingly leads the way in terms of growth and intensification. Gaining over a million residents between 2001-2011, London is now twice the average density of the next densest city-region (West Midlands). The map below shows the complex mosaic of population distribution in Inner London. Lighter colours are higher density, while dark areas have few residents. The low density areas include major employment centres, such as the City of London and West End, and the remaining inner-city brownfield sites. These brownfield sites, such as Kings Cross, Stratford and Battersea, are in the process of regeneration and are undergoing significant intensification.
Figure 1: Population density in Inner London by built-up land (luminocitymap.org)
We can also map changes in population density between 2001-2011 as shown below. Light blue colours have increasing population densities, while purple colours show declining population densities. East London dominates in terms of growth. Indeed the borough of Tower Hamlets comes first on every growth indicator, with the highest population change of any local authority at +28.8%; the highest employment change at a massive +50% (overwhelmingly due to the growth of Canary Wharf); and the highest absolute population density at 324 residents / hectare of built-up land. High population growth rates are also shared in the neighbouring boroughs of Newham (+26.4%) and Hackney (+21.6%).
Figure 2: Population density change in Inner London (luminocitymap.org/LondonChange.html)
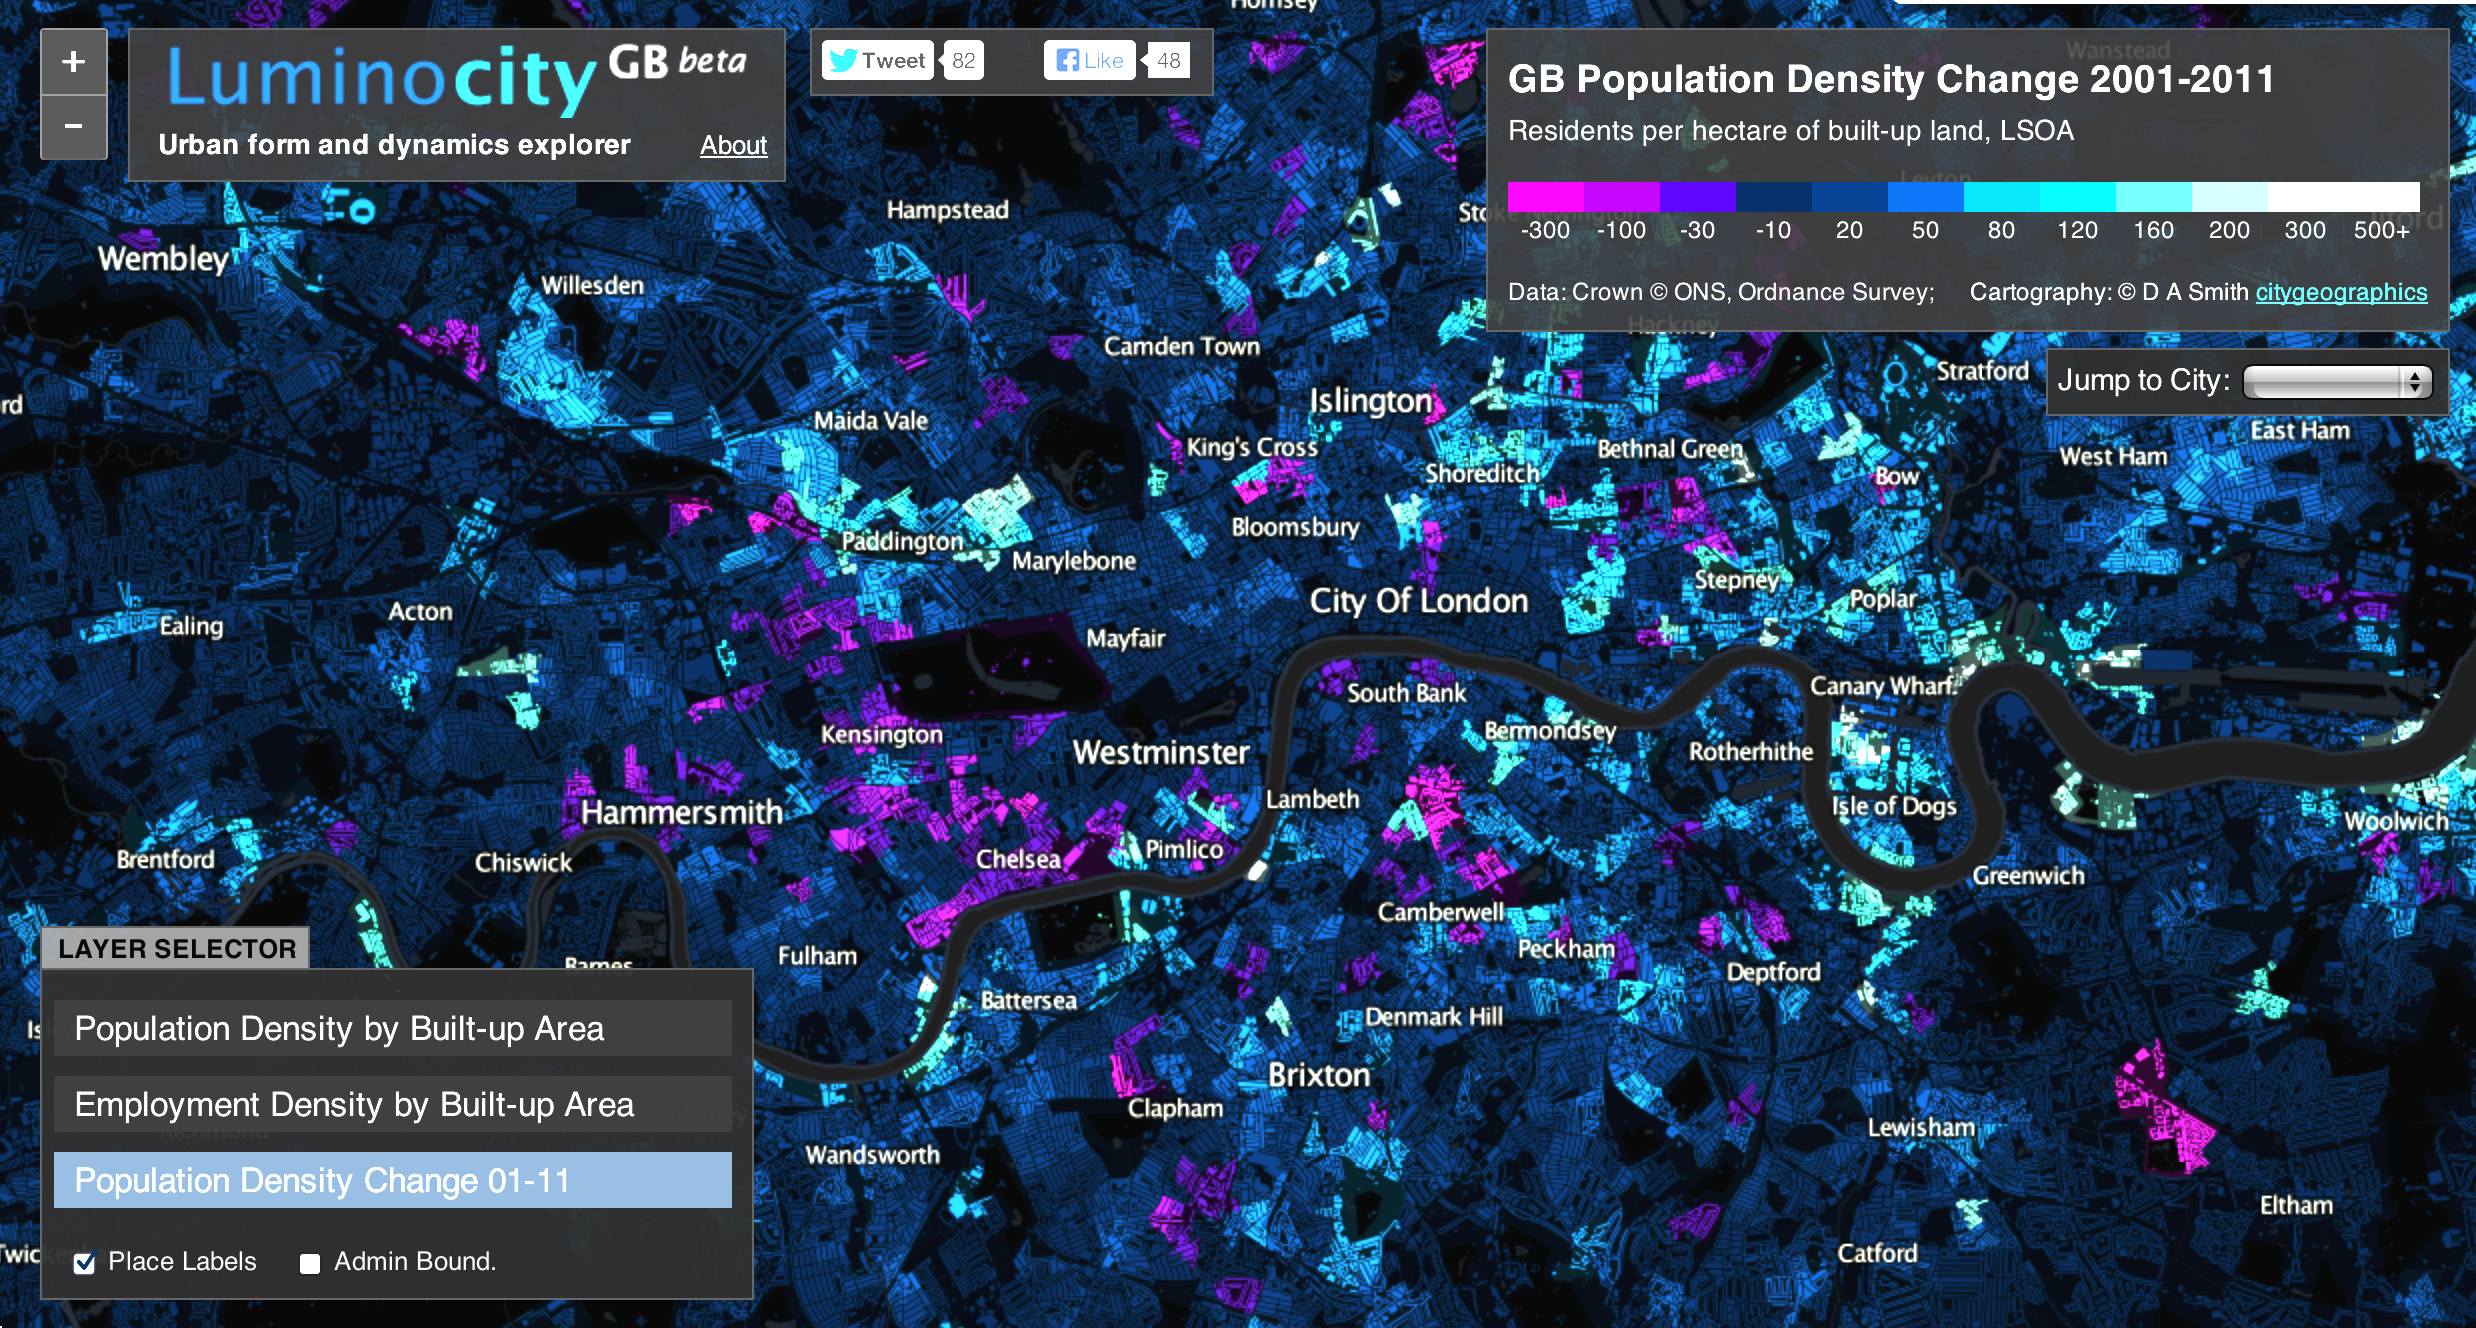
There are however several areas of population decline in Inner London, particularly to the west around Kensington and Chelsea. While this finding does need some context – Kensington and Chelsea remains the fourth most densely populated local authority in the country – it’s still of concern given the extreme population pressures in London. The trend is in line with arguments that the most expensive properties in London have become investments for international capital rather than homes for living. Such trends push prices up and cut supply in the midst of a severe housing shortage and affordability crisis. Meanwhile London’s major brownfield development areas have been slow to deliver significant new supply. The flagship Thames Gateway plan, intended to transform East London and beyond, is yet to deliver on major housing expansion.
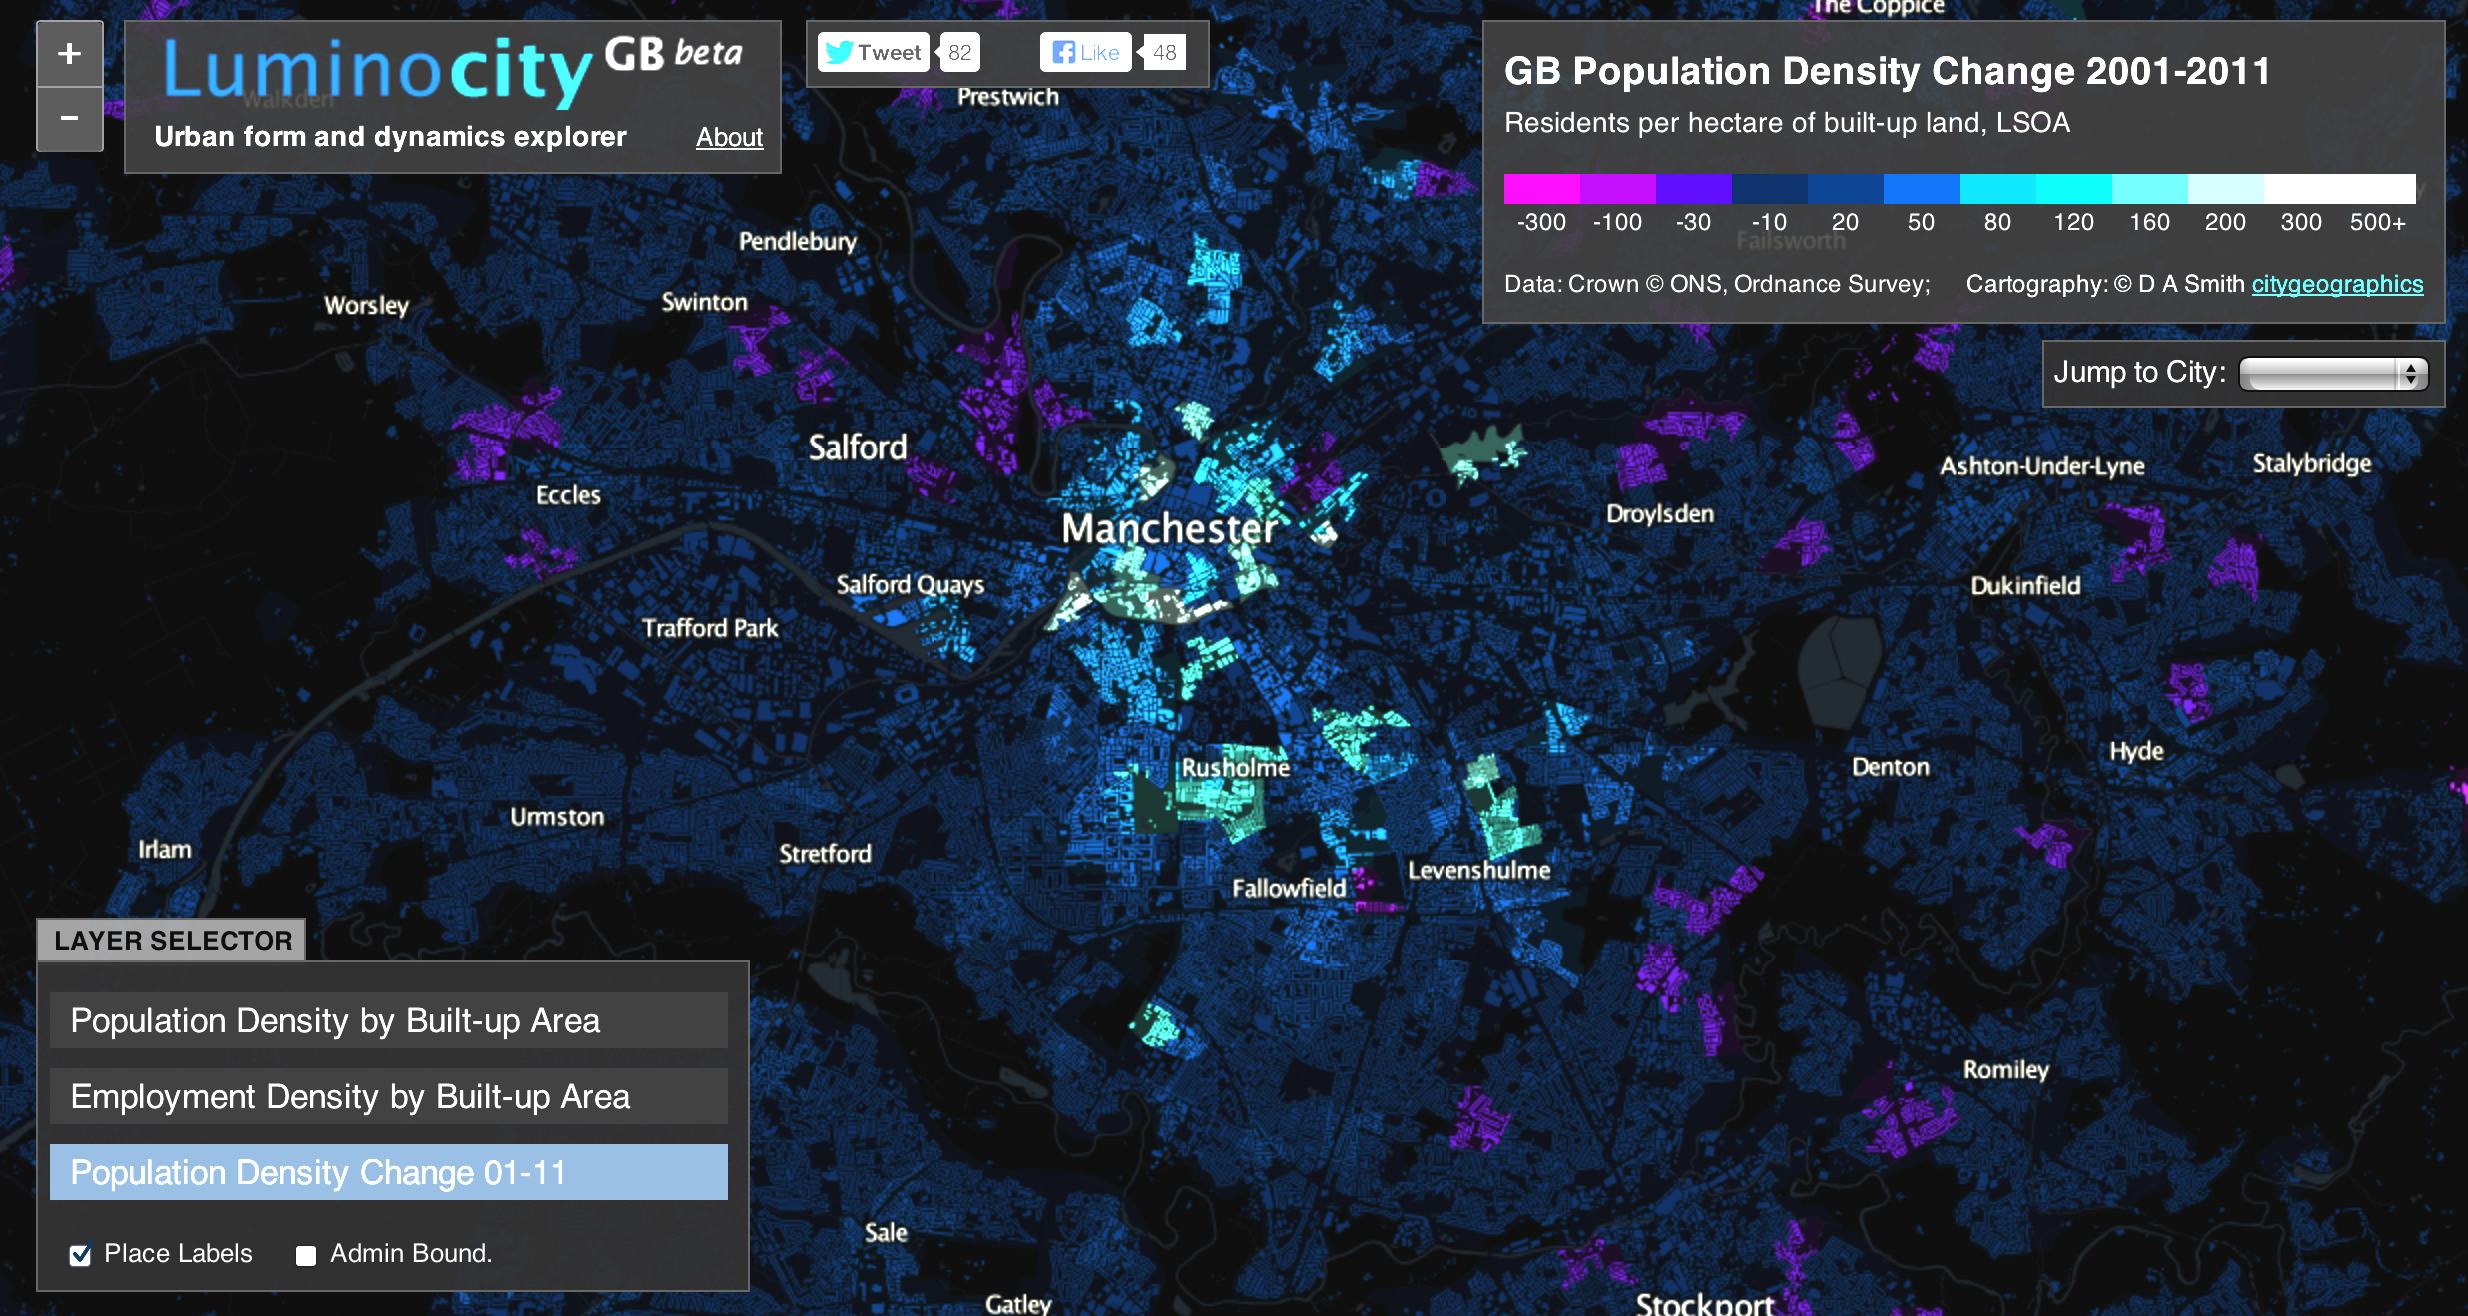
While London’s challenges stem from the failure of housing supply to keep pace with demand, many British cities face more fundamental problems in reviving static and under-populated city centres. Given this context, it is the growth of cities in the Midlands and Northern England that provide the more surprising results of the 2011 census data. Manchester has the fastest population growth after London, with 8.1% growth in the city-region, and a massive 28% growth in the core local authority. Average densities in Manchester have gone up by 28% (+35 residents per hectare). Manchester displays a common pattern found across British cities, with central intensification paired with relatively static or marginally declining suburban populations in the wider region. The nature of central intensification is also quite patchy, with new development sites at a very high 300 or 400 residents per hectare of built-up land, contrasting with low density surrounds and the extensive remaining brownfield sites.
Figure 3: Population density change in Manchester (luminocitymap.org/ManchesterChange.html)
Other large urban regions are also growing. The West Midlands Conurbation is the third fastest growing city-region at 7.3%, with a higher 10% growth in the core city authority Birmingham. Density increases are more modest here (+13 residents per hectare) but the same general pattern remains. Similar patterns of high density inner-city growth are also clear in Leeds (5% growth) and Sheffield (8% growth). There is even more dramatic growth in medium sized cities, such as Leicester (+18%), Nottingham (+14%), Cardiff (+13%) and Bristol (+12.5%).
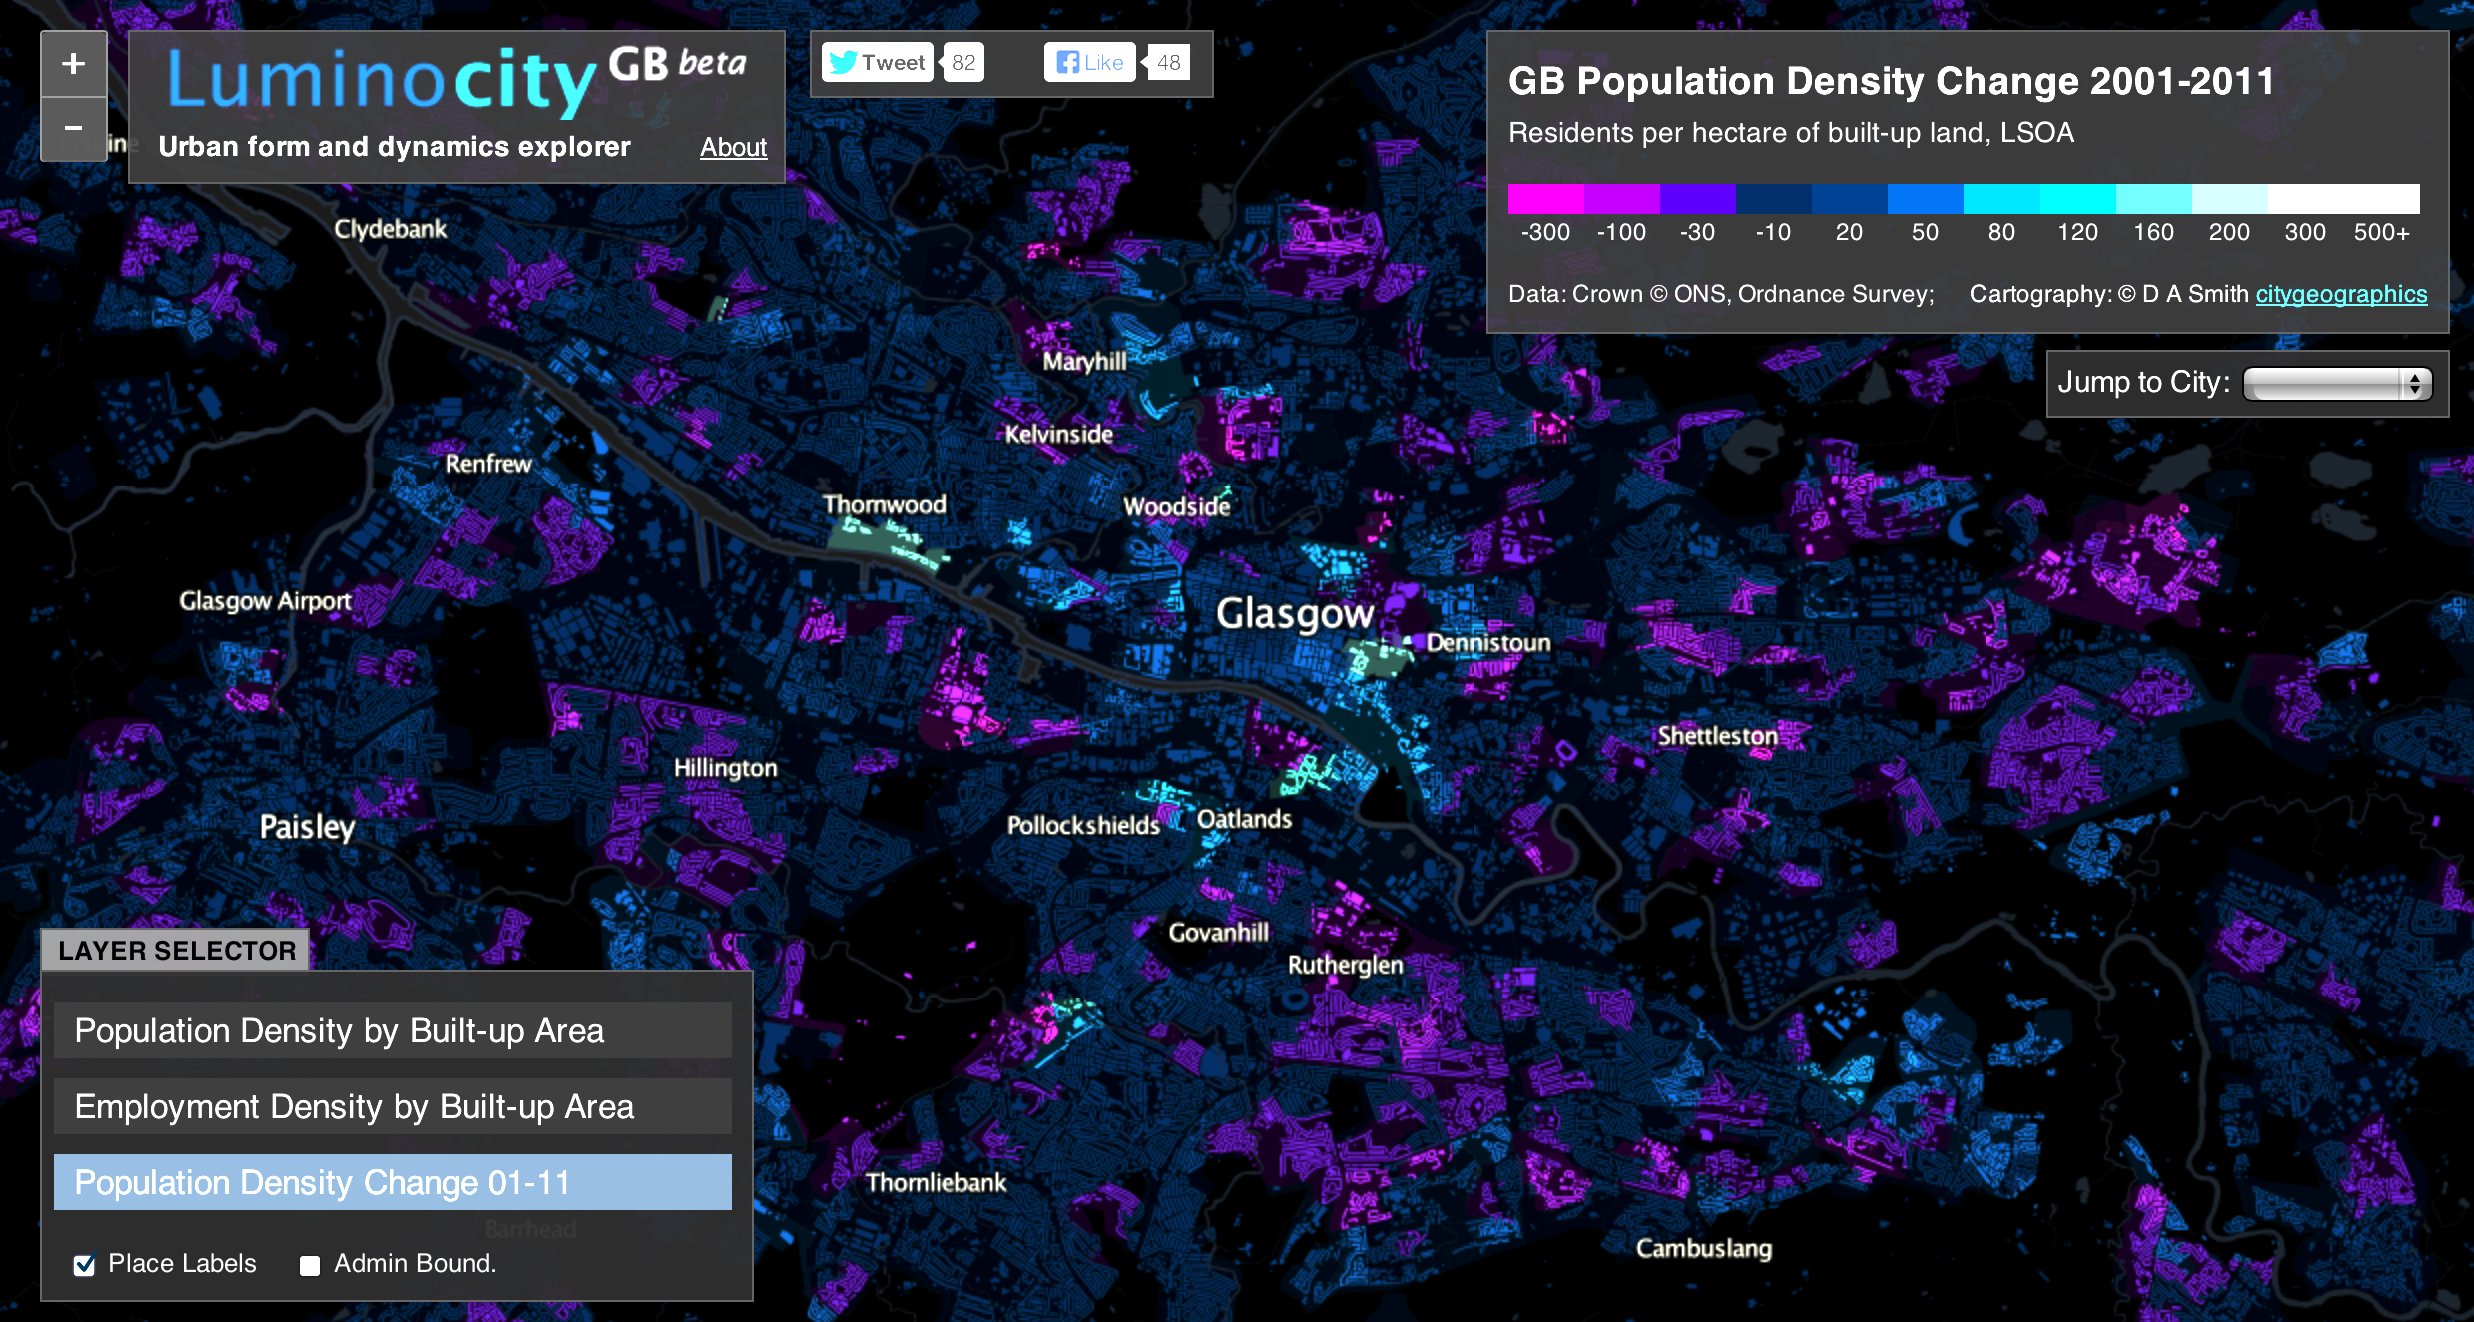
Meanwhile the UK’s former industrial powerhouses of Glasgow, Liverpool and Newcastle display a more problematic variation on this pattern. City centre intensification is still much in evidence, with core city authority populations growing at 8% in Newcastle, 6% in Liverpool and 4% in Glasgow. But this growth is in combination with outright decline in some surrounding towns and suburban areas, particularly around Glasgow. These patterns are linked to major programmes to overhaul poor inner-city housing stock, but are also inevitably linked to weaker economic growth in Glasgow and Liverpool. The picture is better in Tyne & Wear, where there are more positive employment signs (8% growth in workforce jobs 2001-2011).
Figure 4: Population density change in Glasgow (luminocitymap.org/GlasgowChange.html)
To summarise, British cities are, with only a few exceptions, growing significantly. This is a major historic change given the widespread urban decline throughout the second half of the 20th century. And secondly the pattern of growth in density terms is clear: densifying inner cities and fairly static or declining suburbs. London has its own particular dynamics and supply shortfall, while more deprived cities such as Glasgow and Liverpool are still dealing with significant population loss in many areas of the city region. Yet on the whole, the pattern is surprisingly consistent.
Clearly this data review prompts a series of further questions regarding the socioeconomic and property market processes inherent in this urban change, and what future city centres and suburbs will be like. Many factors are contributing to city centre revival and suburban stagnation, including migration, gentrification, household structure change, economic change, and planning policy. These are all inter-related in current city dynamics. Hopefully the Luminocity project is a useful context for this on-going research.
Duncan A Smith is urban visualisation and GIS researcher, interested in city form, dynamics and sustainability. He holds a PhD from the Centre for Advanced Spatial Analysis at UCL, and is now employed at LSE Cities. Current projects at LSE Cities include investigating new urban mobility trends in London and Berlin, and researching the development of green economic growth in Stockholm and Copenhagen. He blogs at City Geographics and can be found on Twitter @citygeographics.


