
Most reviews of research about ethnicity claim it is a concept more scientific than race, and less imposed by those with power. Ludi Simpson reviews recent research about the reliability of ethnicity data drawn from the decennial UK census and reflects on their purpose. Although stable and reliable data is needed to help implement policies of equality and appropriate services, it should not be treated as different to other imposed social categories.
“What ting is dat? … It sound like a germ … How come I become a ethnic minority?” asks Grenadian poet Merle Collins when staying in England. She saw ethnicity like race, a means to put down those who “don’t quite make the grade”. Yet most reviews of research about ethnicity start by claiming that ethnicity is in fact a concept more scientific than race, and less imposed by those with power.
In the Longitudinal Study an anonymised sample of individuals were traced across censuses of England and Wales. It provided the results for this article, a Manchester University Census Briefing, and linked research. The first result of interest is that 4 out of every 100 people who answered the last two censuses are recorded with an ethnicity in 2011 different from 2001. Ethnicity does not remain constant over our life time. It is not a demographic marker, nor a very reliable indicator.
For the past three decennial censuses, the ethnic group of everyone in Britain has been recorded. Each time the question has changed a little, but each time it remains a mixture of colour of skin and country. The latest question offered eighteen choices. There were five opportunities to write in answers in case the other thirteen tick boxes were did not quite fit.
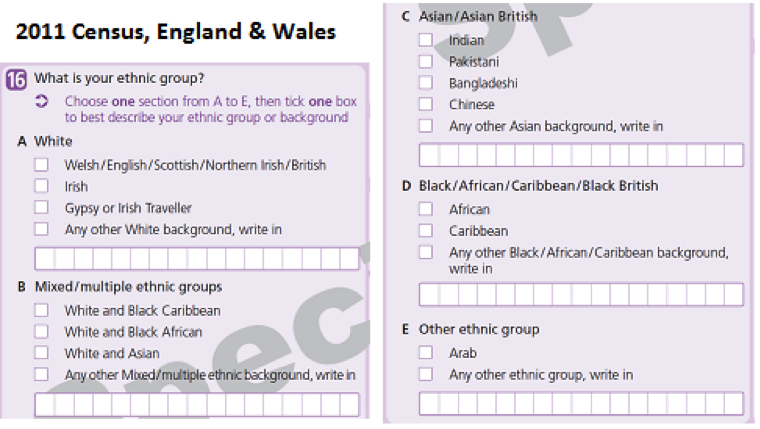
The question does change, to try to keep up with new migration flows that create new diversity. In 2011 categories for ‘Arab’ and ‘Gypsy or Irish Traveller’ were added. 5% of the moves away from the 2001 Census category are accounted for by moves to the two new categories.
This is not the full extent of the impact of question change. Chinese moved to the ‘Asian/Asian British’ heading along with Indian, Pakistani, Bangladeshi and a write-in option. That ‘Other Asian’ write-in box probably now includes all those with Japanese and other far eastern origins.
A further question change probably affected still more people. Under the ‘White’ heading, the first box has been changed from ‘British’ to ‘English/Welsh/Scottish/Northern Irish/British’. Fully a quarter of those who had ticked White Irish in 2001, chose the more inclusive label of 2011. Mind you, quite a large number moved in the opposite direction, so the ‘White Irish’ population only lost 8% overall.
The chart shows the percentage moving to and from each of the 2001 categories. The length of the line to the diagonal shows the net gain or loss from ethnicity switching. The ‘White Other’ category also lost in net terms – again, mainly from those who were on balance happier with the new (improved?) label than the ‘White British’ label of 2001.
Net transfer to each ethnic group from other categories, 2001-2011:

But the changes that might be traced to changes in the question are by no means the whole story. If that was the case, there would not have been reverse movement into White Irish and ‘White Other’. Nor would the changes 2001-2011 have been double the 2% observed for 1991-2001, when the question changed much more fundamentally, dividing a single White category and adding four Mixed categories for the first time.
The question is least reliable for the Mixed and the ‘Other’ groups. Many people find they could answer more than one tick-box answer and choose differently each time. A Latin American might tick White British, White Other, or the final Any Other box. Our answers will depend on how much attention we give at the time we are asked, and who asks us.
Another reason for our changing identity may be that we have come to accept this question over the decades since it was introduced, and now wish to claim an identity that the boxes don’t easily provide. A Turkish may less easily write White British and more easily write in Turkish. A Kashmiri may more readily write it rather than ticking Pakistani or Indian. This would help to explain why the number writing in their response under Mixed, Black, Asian have each gained from other tick boxes over the decade.
This acceptance and insistence on an ethnicity would be in ironic contrast to the resistance the question received before it was allowed on the Census. The 1960s Chief Statistician John Boreham said that the government would never use the concept of ‘colour’ in official statistics. The first attempt in 1981 was abandoned in the face of opposition from form-fillers during testing, particularly in London West Indian communities. And the question is rejected in most of the continent.
Quantifying the fuzziness attached to this thing called ethnicity has nonetheless allowed us to recommend categories that are relatively stable, of which there are seven that carry through from 1991, and twelve from 2001.
Categories in the Census that can be compared over time with relative stability:
- Census categories relatively stable from 2001 to 2011: White British, White Irish, Other White, Mixed White and Black Caribbean, Mixed White and Black African, Mixed White and Asian, Indian, Pakistani, Bangladeshi, Chinese, Caribbean and African.
- Census categories relatively stable from 1991 to 2001 and 2011: White, Caribbean, African, Indian, Pakistani, Bangladeshi and Chinese.
- The remaining categories can be added into a single residual ‘Other’ category for completeness but its composition has changed so much it that its characteristics should not be compared across time.
The purposes of the Census question should be kept under review. Some will dismiss the Census as a crude way of capturing the rich qualitative concept of ethnicity, revelling in the nuances of self-identified diversity that this research has revealed. However, the government does not spend millions of pounds on a census question to encourage self-expression.
The question was introduced first to acknowledge needs of communities that had been ignored, collecting information that would encourage more sensitive delivery of everything from school meals to funeral services. Second, it was introduced on the back of the Race Relations Act to identify social inequalities arising from discrimination in order to do something about them. The extent of discrimination in housing and employment is still regularly exposed, and the composition of the population changing rapidly enough to continue needing these national and local population statistics.
The future of the ethnic group question is surely further change. But those public purposes may act to put a break on the proliferation of categories in analysis. The concept of ethnicity has not much science about it and is no less imposed than other social categories. At the same time the question has to yield stable and reliable data if it is to help implement policies of equality and appropriate services.
Ludi Simpson is Honorary Professor of Population Studies at the Cathie Marsh Centre for Census and Survey Research. He is currently Principal Investigator for the 2011 Census Briefings, technical manager for the POPGROUP demographic software, and updating a previous study of the stability of ethnic and religious affiliation.


Has anyone ever tried recording the colour of people’s skin?