The whole UK will go to the polls on Thursday, with some of the most high profile contests involving the elections of devolved legislatures in Scotland, Wales, and Northern Ireland. Here, Kenneth Bunker of the Democratic Dashboard looks at what we might expect turnout to be in the Northern Ireland, Scotland and Wales elections tomorrow.
With the devolved legislatures of Northern Ireland, Scotland, and Wales all holding elections tomorrow, each country faces different prospects, given their own particular electoral regimes, party systems, and internal current affairs. In addition to questions of who wins and loses, participation is an important issue in itself. How many people will vote? In all three countries turnout has been on the downfall, decreasing between 5 and 15 per cent between the first elections in the late nineties and the most recent one in 2011. Academic literature shows that turnout has an effect on electoral results. If more or less people vote, one or more parties could be benefit, to the detriment of others. In this article I examine trends and speculate on what turnout will look like in each country come 5th May.
Turnout in the United Kingdom
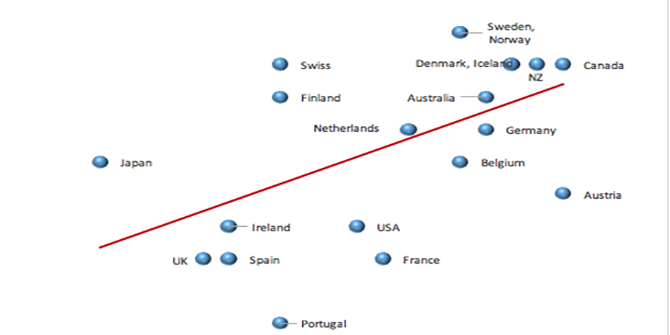
Before fully delving into turnout in Northern Ireland, Scotland, and Wales, it is important to define precisely what we are talking about. Turnout is defined as the percentage of eligible voters who cast a ballot in an election. In the UK, this means citizens of 18 years of age or older living within the territory (16 or over for Scottish Parliamentary elections). Turnout in the United Kingdom is low in an international context, especially in comparison to countries in which eligible voters are mechanically merged into the electoral roll and face penalties if they do not vote (automatic registration and compulsory voting). Turnout for Westminster elections has varied over time. Between 1945 and 1997, it never fell below 70 per cent. However, in the four most recent elections (2001, 2005, 2010, 2015), it has averaged 63 per cent. Of these four elections, the lowest was in 2001 (59.4 per cent), and the highest was in 2015 (66.1 per cent). It is noteworthy, however, to mention that after a slump in the early 2000s, turnout has steadily been increasing.
Important elections today – Credit: Paul Albertella CC BY 2.0
If we disaggregate these statistics into the countries that will hold devolved elections in 2016, a pattern emerges. Table 1 shows that of the past four Westminster elections (held every four or five years), Wales is the country with highest turnout, with an average of 63.7 per cent. It is closely followed by Scotland, with an average turnout of 63.5 per cent, and Northern Ireland with an average turnout of 61.7 per cent.The lowest turnout in the Table is in the UK in 2001, for Tony Blair’s first re-election, suggesting that in less competitive elections, fewer people vote. In contrast, the highest turnout is Scotland in 2015, in the midst of its bid for independence, suggesting that when elections are marked by a distinctive political juncture, more people vote.

Turnout in Northern Ireland, Scotland, and Wales
In contrast to turnout rates in Westminster elections, turnout rates in the devolved elections of Northern Ireland, Scotland, and Wales are significantly lower. This comparatively lower turnout can be largely explained by the reasons outlined above. Naturally, elections in devolved legislatures tend to be less competitive and less prone to be marked by distinctive junctures than nation-wide elections. Indeed, low turnout rates seem to hold over time in these countries, partially because of the stability of partisan domination patterns. The DUP, the UUP, and Sinn Féin dominate elections in Northern Ireland; Labour systematically wins in Wales; and the SNP has established a hegemony of votes and seats in Scotland.
Table 2 shows that turnout in Northern Ireland has been steadily decreasing. It has fallen around 15 per cent between the first election (1998) and the most recent one (2011). Of the three countries, it has been the one with highest turnout, but sharpest decline. Table 2 and Figure 2 also show that turnout in Scotland has alsofallen, but at a more stable rate. It has fallen 9 per cent between the first election (1999) and the most recent one (2011). In the past three elections it has averaged 50 per cent turnout. Turnout in Wales has also been steadily decreasing, falling 4 per cent between the first and most recent elections. Of the three countries, it has been the one with lowest turnout, but also the one with the slowest rate of decline.

What does this mean?
An interesting pattern emerges when comparing turnout rates at the country-level between Westminster elections and devolved elections. The countries that have high turnouts in Westminster elections have low turnouts in devolved elections. While in Westminster elections Northern Ireland is the country with the lowest turnout, in devolved elections it is the country with the highest turnout. Similarly, in Westminster elections Wales is the country with the highest turnout, whereas in devolved elections it is the country with the lowest turnout. In both types of election, Scotland is mid-ranked in average turnout, but it is also the one with the most extreme values. This is particularly visible in the most recent Westminster election, where it had the highest historical turnout (71.1 per cent).
The patterns visible in Westminster elections and devolved elections are different. They respond to different phenomena; the former are arguably more competitive and jam-packed with political junctures. In terms of anticipating turnout rates of the upcoming devolved elections, it is more useful to use the turnout rates of previous devolved elections than Westminster elections as proxies. However, it is not entirely possible to ignore the state of the current competition and the possibility of emergence of new distinct critical junctures. This information, often provided by public opinion polls, can complement any picture of turnout. Historical trends can be used as a trustworthy baseline as long as they are updated by polls.
What will happen tomorrow?
In line with the above, the data suggests that Scotland will be the country with highest turnout in the next election. Not only has it been stable over the past three elections, but it has also gained national and international attention, given the efforts related to its prospective independence. Northern Ireland will slip into second place in turnout rates. The competition between the DUP and Sinn Féin to secure the first place will likely bring turnout to around 50 per cent. It follows that Wales will be the country with the lowest turnout of the three. Even though it has the highest turnout in Westminster elections, in devolved elections it faces no junctures or competition – in every scenario polls point to a landslide victory in favour of the Labour Party.
—
This post first appeared on the Democratic Audit UK.
 To find out more about elections happening near you tomorow, visit the Democratic Dashboard.
Dr Kenneth Bunker is a Researcher at Democratic Audit at the London School of Economics.