While examining previous trends and research on capital flows and total factor productivity, Aniruddha Ghosh and Sujan Bandyopadhyay write that India must be careful to continue to maintain the positive correlation between growth and net foreign capital flows.
“Among all the means of power subordinate to the regulation of the State, the power of money is the most reliable, and thus the States find themselves driven to further the noble interest of peace, although not directly from motives of morality”— Immanuel Kant, “Perpetual Peace: A Philosophical Sketch”,1795
While the Kantian view on increasing economic integration was primarily driven by considerations of war and peace, international capital flows and their management have become pivotal to the macroeconomic growth and stability of modern economies. Over the course of the last two decades, India’s net capital flows have surged from little over the US $500 million in the first quarter of 1990-91 to the US $25.38 billion in the first quarter of 2017-18.
In This Time is Different (2011), Carmen Reinhart and Kenneth Rogoff flag an important historical insight: Periods of high international capital mobility have repeatedly produced international banking crises, not only famously as they did in the 1990s, but historically.
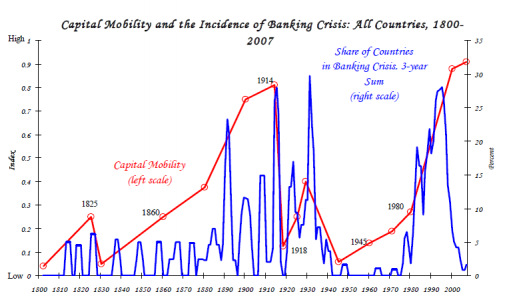
Figure 1: Periods of high capital mobility have often been associated with higher incidence of banking crises Source: Bordo et.al (2001), Caprio et.al (2005), Kaminsky and Reinhart (1999), Obstfeld and Taylor (2004), Reinhart and Rogoff (2008)
The traditional neoclassical technology models tell us that net financial capital flows should move from richer to poorer countries. That is, it should flow from countries that are capital-abundant, and thus lower returns, to those that are capital-scarce (higher returns) and have greater investment opportunities.
Robert Lucas Jr . has pointed out an empirical paradox using the 1988 data: If the traditional neoclassical model were true, the rate of return on a unit of capital investment in India would be nearly 58 times more than the return one would get in the US, yet the level of capital flows to India from the US were modest and nowhere near the levels the traditional theory predicted. Hence, the traditional neoclassical theory fails to imbibe the assumptions of cross-country differences in productivity and capital market imperfections. After accounting for cross-country differences in the fundamentals and capital market frictions, the risk-adjusted returns to investment should govern capital flows and therefore, should resolve the paradox. However, the paradox remains as relevant today given that the poorer countries of the world tend to run current-account surpluses (thus exporting capital) and the richer ones (most notably the US) tend to run current-account deficits (thus importing capital).
The paradox gets rather perverse when we move from absolute levels of income to income growth. In 2006, Foreign Capital and Economic Growth,” written by Eswar Prasad, Raghuram Rajan and Arvind Subramanian and published by the International Monetary Fund, took the question of capital flows one step forward. The paper presented evidence to support the intensification of the Lucas Paradox, while observing that within developing countries, growth and foreign capital inflows were, in fact, negatively correlated. This meant that poorer countries which had higher amounts of net foreign capital inflows had lower economic growth than those that didn’t. Additionally, within the group of poorer nations, capital flows out of countries that grow faster. Interestingly, this relationship breaks down for developed nations, i.e. developed nations have a positive correlation between growth and foreign flows.
The authors of the IMF paper argue that there could be a number of reasons why we see this anomaly between growth rates of developing countries and their foreign capital flows.
Firstly, successful developing countries may have a limited ability to absorb foreign capital flows due to structural impediments in their financial sector. Secondly, it is possible that developing nations actively make the choice to avoid excess foreign flows to prevent overvaluation of assets. And the final conclusion is that nations develop, structural impediments in their financial sectors reduce and their ability to absorb foreign flows increases – such that it can become a driver of growth, like industrialized nations, in the long run.
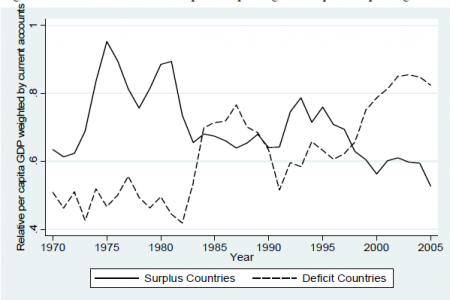
Figure 2: The composition of capital exporting countries has changed from higher to lower income countries and the Lucas Paradox seems to reinforce over time. Source: Prasad, Rajan and Subramanian (2006)
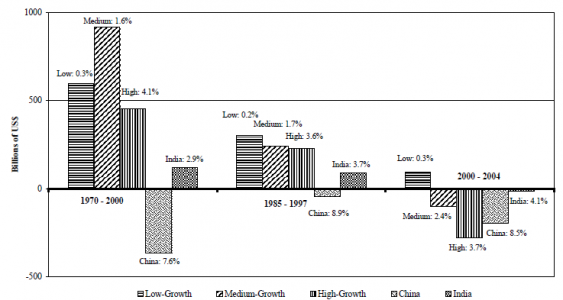
Figure 3: Countries with higher growth have attracted less net foreign capital than medium- and low-growth groups. Particularly, China and India have been exporters of capital despite high economic growth. Source: Prasad, Rajan and Subramanian (2006)
To explain these rather perverse findings presented in the IMF paper , Francisco J.Buera and Yongseok Shin in their 2017 paper, “Productivity Growth and Capital Flows: The Dynamics of Reforms”, focus on the relationship between growth accelerations in total factor productivity (TFP) and capital flows. They attribute the observational findings to the disparate dynamics of aggregate savings and investment behavior. For the readers, TFP accounts for the growth in output not accounted for by the growth in inputs used for its production and is often synonymous with improvements in the technological state of an economy. A rising TFP is necessary for a higher economic growth rate and therefore, investment in R&D is essential for sustained economic growth.
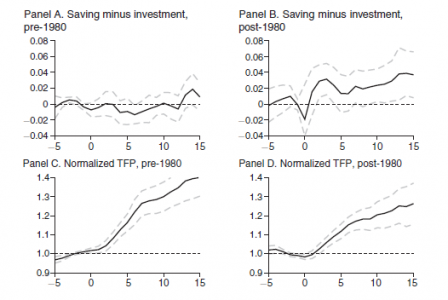
Figure 4: Panels A and C show, respectively, the average of saving minus investment rates and TFP over the 33 episodes of sustained accelerations before 1980. The pre-1980’s negligible savings and investment gap confirms our understanding of limited capital flows. Panels B and D show the average over 22 such episodes after 1980. Source: Francisco J. Buera and Yongseok Shin (2017)
Buera and Shin present the following observations using data for 22 sustained growth acceleration episodes post-1980. First, in contradiction to the predictions of standard neoclassical models, capital flows out of countries experiencing fast growth in output and TFP. Second, this pattern is a lot more prominent in the early stages of these growth accelerations, where many of these nations undergo economic reforms. These first generation reforms are primarily concerned with the removal of idiosyncratic distortions (tax-cuts) in their economies. Finally, capital outflows reflect a surge in aggregate savings and a delayed rise in aggregate investment at the onset of sustained growth accelerations. Interestingly, when the reform is a far-reaching one – it removes goods market distortions as well as improves the health of financial institutions (second generation reforms) – capital flows into the countries experiencing faster TFP growth.
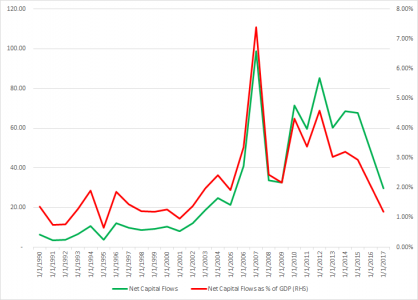
Figure 5: Net Capital Flows & Net Capital Flows as a percentage of GDP (RHS) for India since 1990. Note the peak of capital flows coincides with the Great Recession as ‘plata dulce’ moved around the world easily. Source: Authors’ Calculations and Bloomberg
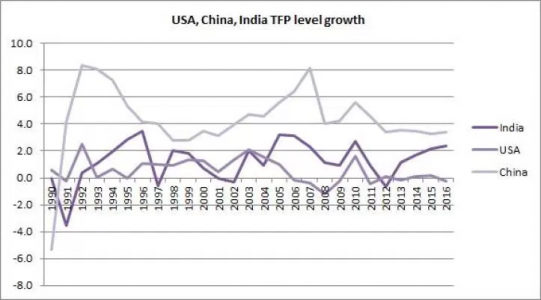
Figure 6: Total Factor Productivity level growth in India, China, and the US. India has been on a rising TFP path. Source: Authors’ Calculations and The Conference Board
India has had a long and chequered history with foreign capital flows. The first few decades after independence were characterised by import substitution policies which placed severe restrictions on the flow of foreign goods and capital, and it is only in the last few decades that foreign flows to India have really picked up. In the last two decades, both net foreign capital flows and GDP have grown substantially indicating a positive correlation, though this positive correlation is not as strong as the traditional neoclassical models predict. In light of the fact that there have been rising TFP levels in recent years as well, India must be careful to continue to maintain this positive correlation between growth and net foreign capital flows. Rakesh Mohan, in a speech in 2008 in his capacity as the Deputy Governor of the Reserve Bank of India said, “A large surge in capital [in]flows over a short span of time in excess of domestic absorptive capacity of the economy can lead to upward pressure on the exchange rate, possible overheating of the economy and asset price bubbles. They can also pose the risk of an abrupt reversal, which may have potential negative real economic effects.” With far-reaching reforms in the goods and capital markets, it becomes imperative for the NDA government to keep these historical and policy insights in mind.
Cover image: The Mumbai stock exchange. Image credit: CCO Creative Commons
This article gives the views of the authors, and not the position of the South Asia @ LSE blog, nor of the London School of Economics. Please read our comments policy before posting.
About The Authors
 Sujan Bandyopadhyay has completed his MSc in Economics at the London School of Economics and Political Science, and currently works for CAFRAL, Reserve Bank of India.
 Aniruddha Ghosh is a graduate student who has recently completed his MSc. Econometrics and Mathematical Economics from London School of Economics.


1 Comments