 In 2010, the Republican Party regained the House of Representatives, gaining 63 seats from the Democrats. Jamie L. Carson and Stephen Pettigrew take a close look at what fueled this near unprecedented gain, as well as Republican victories in the Senate. They argue that rising unemployment, President Obama’s declining approval ratings across the board, and the Republican ability to field many more candidates with previous electoral experiences were all factors in the Democrats’ significant defeat. They write that one of the consequences of the 2010 result was a much more politically polarized Congress, something that is still very much the case in 2013.
The 2010 midterms will likely go down as one of the most historic elections in the modern era. With the biggest turnover at the midterm for either party since 1938, Republicans regained control of the U.S. House of Representatives, following four years of Democratic leadership. After enjoying a near-filibuster proof majority, Democrats’ share in the Senate was reduced to just 53 seats. Additionally, the election showcased the burgeoning Tea Party, a conservative grassroots movement with a distinct anti-Washington, anti-incumbent flavor. But what influenced this result, and what have been the consequences for Congress?
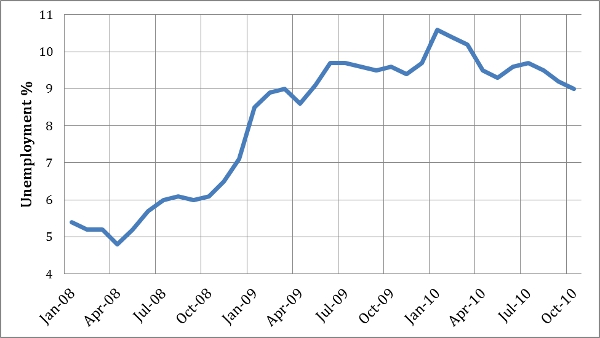
Much of the focus of congressional campaigns in 2010 was on the unemployment rate and job creation. Just as the financial meltdown and economic downturn were the key issues in the 2008 presidential race, conditions had not improved by early 2010. Figure 1 shows the national unemployment rate from the beginning of 2008 to November 2010. When Obama took office in January of 2009 the unemployment rate was at 8.5 per cent. One year later it had grown to 10.6 per cent. The figure slightly dropped in 2010 to 9 per cent, but with such a high number of Americans without jobs, this became the top political issue for Republicans. Considerable debate ensued over whether President Obama or former President Bush should properly receive blame for the poor economic conditions. Although increases in unemployment during the first couple months of his term could not be blamed on Obama, by 2010 it became more difficult for the Democrats to pin the blame on the policies of President Bush.
Figure 1 – National unemployment rate 2008 – 2010
During the first two years of the Obama Presidency, two important pieces of legislation were enacted—the American Recovery and Reinvestment Act (the stimulus) and the Patient and Protection and Affordable Care Act (Obamacare). Although both were key accomplishments for the Administration, they were not without controversy. The political consequences of these domestic policies, as well as the perpetually high unemployment rate, can be seen in Obama’s approval rating. Figure 2 shows the steady decline in approval for President Obama between his inauguration in 2009 and the midterm elections in 2010. The middle line represents a smoothed average for his approval rating. The top and bottom lines map approval ratings for Obama among Democrats and Republicans, respectively. Approval steadily declined during Obama’s first two years in office. At the time of his inauguration, his overall approval was about 65 per cent, but by October 2010 it had diminished to around 45 per cent. Democrats began Obama’s term approving of the president at a rate of about 90 per cent and declined to 80 per cent by the midterm elections. For Republicans, however, the figure began at 40 per cent but quickly dropped and spent most of late 2010 hovering around 10 per cent.
Figure 2 – Approval ratings for President Obama 2009 – 2010
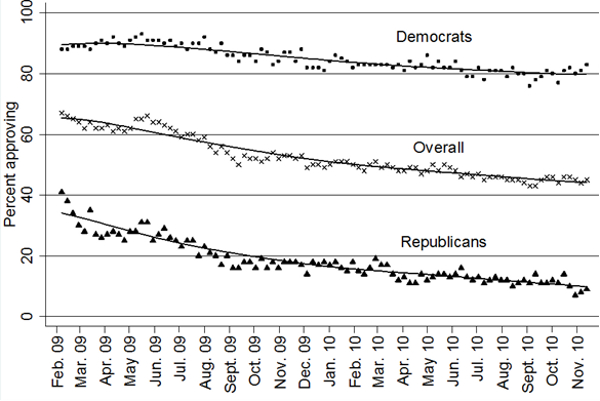
Source: Gallup.
It should not come as a surprise that Republicans in 2010 had more success at candidate recruitment than Democrats. In terms of overall recruitment, the Republican Party was able to field a candidate in all but five House elections in 2010, something truly unprecedented. Democrats, on the other hand, left 24 Republicans running uncontested. The gap between the parties is even more apparent when one takes into account the backgrounds of the candidates being recruited. Republicans entered the November election with 77 challengers who had previous elective experience, compared to just 46 for the Democrats. This gap was even more substantial in races featuring an incumbent. The GOP recruited almost twice the number of quality challengers to face incumbents than did the Democrats.
The recruiting gap between the two parties is more stark when put into historical context. Figure 3 shows the difference in the number of quality candidates recruited for each party since 1946. Data points that lie above zero represent a Republican advantage, and points below zero represent a Democratic advantage. The graph demonstrates the historical significance of the Republican recruiting advantage in 2010. Having 32 more quality candidates on the ballot than the Democrats represents the largest Republican advantage since 1946, one more than the 1966 midterm elections. The Republican advantage in 2010 is also the sixth largest gap in favor of either party since the end of World War II.
Figure 3 – Republican advantage in candidate recruitment in the modern era
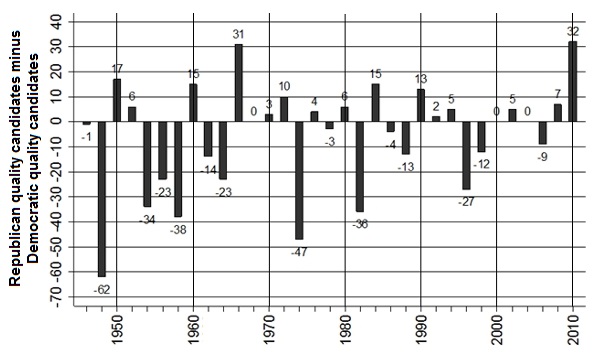
Source: The data for this graph and all other discussions of previous congressional elections were graciously shared by Gary Jacobson.
In the modern era, incumbents tend to win at overwhelmingly high rates. Despite the historic nature of the 2010 elections, this was still true to a limited extent. Of all the incumbent members of the House that sought reelection in 2010, 85 per cent of them won their race. Omitting the cases of unopposed incumbents, the vote proportion for incumbents is normally distributed around the mean of about 63 per cent. Yet just because the average incumbent vote was over 60 per cent, this does not mean that it was smooth sailing for all incumbents in 2010. Indeed there were 54 incumbents seeking reelection that were defeated in the general election. Two of these incumbents were Republicans; the remaining 52 were Democrats.
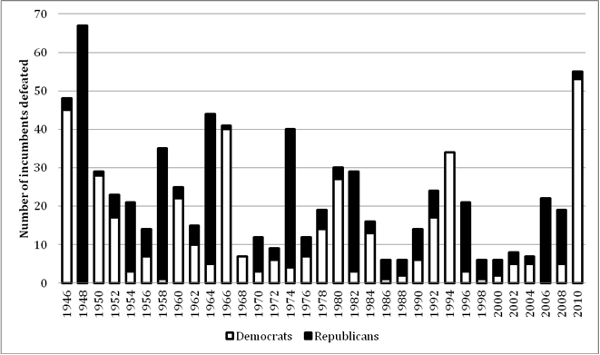
Figure 4 below places these high incumbent defeat numbers in a historical context. The bar graph demonstrates that 54 defeated incumbents is the largest such value since 1948. The 52 Democrats who were defeated is the largest number since at least 1946. This graph makes the Democratic waves of 2006 and 2008 look like nothing more than ripples; the combined number of defeated Republican incumbents in these elections is still less than the number of defeated Democrats in 2010. One possible explanation for this trend against Democratic incumbents could be that voters were holding members accountable for controversial roll-call votes. Almost every defeated incumbent (48) voted in favor of the stimulus package, and a majority (35) voted for healthcare reform. Of the 34 Democrats who voted no on healthcare reform, 13 were reelected, 7 lost in the general election, 2 sought higher office, and 2 retired.
Figure 4 – Incumbents defeated in House elections, 1946 – 2010
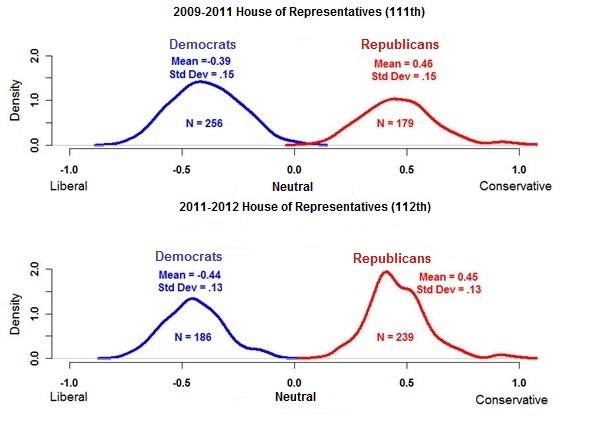
One immediate and important consequence of the 2010 midterm elections was that it further increased the level of polarization between the parties in Congress. Figure 5 shows the rift between the ideal points of the two parties, as measured by DW-NOMINATE scores. As a result of moderate Democratic incumbents losing in the 2010 elections, the mean Democratic ideology (shown in blue) moved to the left. Republicans (shown in red), however, were not expected to become more moderate. If campaign messages are any indication, Republican freshmen were expected to be much more extreme in their ideological position than were Democratic freshman in either 2006 or 2008. The direct result of this polarization was more partisan gridlock with respect to legislation; Republicans sought to defund aspects of Obama’s healthcare reform package and significant battles were fought over the federal budget and government debt ceiling. This partisan polarization has extended into the 113th Congress as well.
Figure 5: Polarization in Congress 2009 – 2011
Perhaps the strongest message that 2010 midterms for those who follow elections was that idiosyncratic factors can still have a strong influence on congressional races.
Please read our comments policy before commenting.
Note: This article gives the views of the author, and not the position of USApp– American Politics and Policy, nor of the London School of Economics.
Shortened URL for this post: http://bit.ly/1ekXQ6N
_________________________________________
Jamie L. Carson – University of Georgia
Jamie Carson is a Professor in the Department of Political Science at The University of Georgia. His primary research interests are in American politics and political institutions, with an emphasis on rational choice theory. Most of his current research focuses on congressional politics and elections, American political development, and separation of powers.
Stephen Pettigrew – Harvard University
Stephen Pettigrew is a third year graduate student in the Harvard Government Department. His primary research interests are in the fields of American politics and political methodology. Within American politics he studies elections, Congress, political institutions, voting behavior, electoral administration, and American political development.