 Over nearly two centuries, American presidential elections have exhibited a distinct cycle. This is not the pattern associated with partisan realignments that may last 30 years or so; it is a shorter cycle that relates to party control of the White House. A cyclical model of presidential elections developed by Helmut Norpoth predicts that in 2016 it will be time for a change. After two terms of Democratic control of the White House under President Obama, the Republican Party is poised to return to the White House.
This article is part of a collaboration with the PS: Political Science and Politics symposium on US Presidential Election Forecasting. Click here to read other posts in this series
Trying to predict the winner of a presidential election nearly three years ahead of time sounds more like an indulgence in astrology than an exercise in science. None of the usual suspects in election forecasting offer any guidance that far ahead: the approval of the sitting president, the state of the economy, the outcome of the 2014 midterm elections, or trial heats between the major-party nominees yet-to-be determined. So, is there any way to make a forecast for 2016 that does better than flipping a coin? The answer is yes. A cyclical model of presidential elections predicts that in 2016 it will be time for a change. The Republican Party is poised to return to the White House.
This 2016 forecast rests on a model that tracks cyclical movements in American presidential elections. It goes back to 1828, when popular voting became widespread and the two-party system took hold. Over nearly two centuries, American presidential elections have exhibited a distinct cycle. This is not the pattern associated with partisan realignments that may last 30 years or so, but a shorter cycle that relates to party control of the White House. As an example, consider how the White House party has fared in successive elections during the last half century, as shown in the Table below.
Table 1
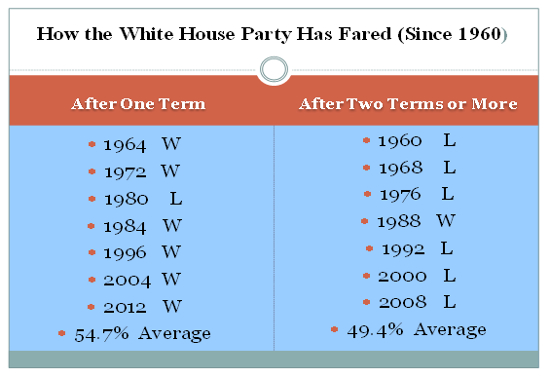
After one term the party in the White House has won nearly every election between 1960 and 2012; six of seven, to be exact, averaging 54.7% of the two-party vote. On the other hand, after two terms or more, the White House party has lost nearly every election; again, six of seven, averaging 49.4% of the two-party vote. Re-election looks like a sure thing when the party is in office just one term, while a change in the White House looms after two or more terms, as will be the case in 2016. The change may not be of landslide magnitude, as is quite common in victories after one term. And the 2000 election was a loss for the White House party only in the Electoral College, not the popular vote.
One may also quibble over the 1976 and 1992 elections. Didn’t Gerald Ford and George H. W. Bush both go down to defeat after having served one (or even less than one) term as president? That is certainly true, but keep in mind that the pattern of interest is about the presidential party, not the candidate! By 1992, Republicans had been in the White House for three terms, with Reagan and Bush; by 1976, Ford was finishing Nixon’s second term. Neither Ford nor Bush (the Elder) became president in an election that swept out the other party. Both succeeded presidents of their own party and had to deal with the record of their predecessors, whom they served as vice presidents. Hence they are not treated as first-term presidents.
The pattern of election outcomes between 1960 and 2012 hints at the existence of an electoral cycle. Party control of the White House oscillates with striking regularity: a stay in the White House for two to three terms followed by a stay out of it for a similar duration. This is not just a feature of the last half century of American politics. That period simply provides an illustration using elections that would seem familiar to most observers. As Figure 1 illustrates, the electoral cycle can be spotted in presidential elections all the way back to 1828, when popular voting took hold across the United States. Since then, the Democratic Party has been a constant force in electoral politics, contending with the Republican Party since the 1850s, and its predecessors before then.
Figure 1 – Democratic share of Presidential vote, 1828-2012
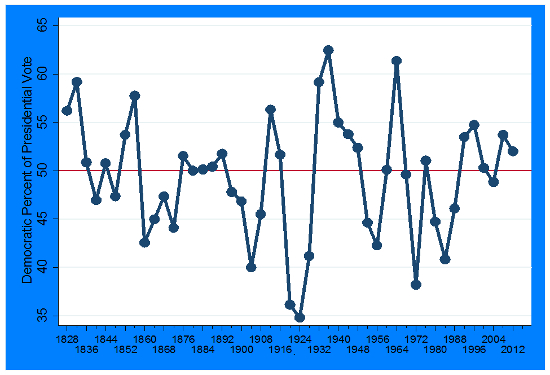
The Democratic share of the major-party vote displays a cyclical movement that is not too hard to discern with the naked eye. There are roughly nine cycles in the vote series from 1828 to 2012, albeit with varying length (period) and range (amplitude). The periodic behavior of such “disturbed” time series can be captured, as British statistician George Udny Yule showed in a paper published in 1927, by a second-order autoregressive model.
I applied this model to the presidential vote series from 1828 to 2012 to estimate the length (period) of the cycle. The result is 5.2 terms, which amounts to roughly 20 years. That is how long it takes for a full run of a cycle, from when a party first captures the White House to losing it and then regaining it. In other words, a party can count on holding the White House for half of that period, or 2.6 terms. This confirms the pattern of elections from 1960 to 2012. Getting re-elected after one term is a safe bet for the White House party. After two terms, however, the prospect of another victory looks less favorable, and after yet another term, defeat looms large.
The autoregressive equation lends itself to an immediate forecast of the next election. No data are required other than the vote in the previous (t-1) election and the vote in the election prior to that (t-2). Both are known with certainty now, and have been known since the results of the 2012 were officially posted. Using the Democratic vote percentages in 2012 and 2008, the cyclical model predicts a Republican victory in 2016 with 51.4% of the two-party popular vote. After two terms the cyclical model points to “time for a change,” just as it has in nearly every such election during the last half century.
This article is based on the paper ‘The Electoral Cycle’ appearing in this month’s PS: Political Science and Politics symposium on US Presidential Election Forecasting.
Featured image credit: Adam Fagen (Creative Commons BY NC SA)
Please read our comments policy before commenting.
Note: This article gives the views of the author, and not the position of USApp– American Politics and Policy, nor of the London School of Economics.
Shortened URL for this post: http://bit.ly/1eAFvVd
_________________________________________
Helmut Norpoth – Stony Brook University
Helmut Norpoth is professor of political science at Stony Brook University. He is co-author of The American Voter Revisited and has published widely on topics of electoral behavior. His current research focuses on public opinion and elections in wartime.


1 Comments