 It is well known that elections are determined by certain fundamental variables: internal factors that reflect voters’ long-term political predispositions and external factors that are unique to each campaign. Robert S. Erikson and Christopher Wlezien examine how one external factor, the state of the economy, compares to how voters’ internal factors evolve over the final 200 days of presidential campaigns. They find that while noneconomic factors dominate at the outset of the campaign, the economic component increases in salience as Election Day draws nearer and offers greater electoral predictability overall.
This article is part of a collaboration with the PS: Political Science and Politics symposium on US Presidential Election Forecasting. Click here to read other posts in this series.
It commonly is said that elections are determined less by the quality of electoral campaigns than by fundamental forces that astute observers can see coming in advance. We offer a system in which electoral fundamentals come in two varieties: internal and external. Internal fundamentals are part of the voter’s long-term political predispositions: party identification, ideological proclivities, and demographically-based partisan orientations. External fundamentals are short-term forces unique to the campaign, such as, but not limited to, the state of the economy. Both types impact the evolution of electoral preferences in different ways. The internal ones operate as centripetal forces pushing the electorate toward 50-50 (a party line vote) and the external ones work as centrifugal forces pushing voters outward toward some unique outcome specific to the issues of the day.
From available poll data, we estimate the presidential preferences of the electorate on a daily basis over the final 200 days of each of the 15 elections from 1956 to 2012. We also do the same for economic perceptions, specifically, about current economic growth, as measured by the Survey of Consumers at the University of Michigan. Using these two resources, we divide daily presidential preferences in different election years into two components—the share that is predictable from economic perceptions on that date and the residual portion that is unrelated to those perceptions.As a rough approximation, the section of the “vote” predictable from economic perceptions serves as a proxy for the external fundamentals. The remaining residual portion proxies the internal fundamentals. We ask: how do the two sources of voter preference (predictable versus not predictable from economic perceptions) evolve over the final 200 days of presidential campaigns?
The Growing Effect of the Economy over the Campaign
We start with the early stages of the campaign, 200 days before the election (April of election year). At that time, economic perceptions barely register as a predictor of the trial-heat polls (which pit possible presidential contenders against each other in hypothetical general election matchups). See the left panel of Figure 1, which plots the incumbent party candidate’s poll share and economic perceptions in April of the election year. The correlation between economic perceptions and the polls at that time is negligible. By Election Day, however, voter preferences are clearly responsive to perceptions of economic progress. This trend can be seen in the right panel of Figure 1, which displays the incumbent party candidate’s vote share and economic perceptions at the end of the cycle.
Figure 1: Predicting the Polls in April and the Vote in November from Economic
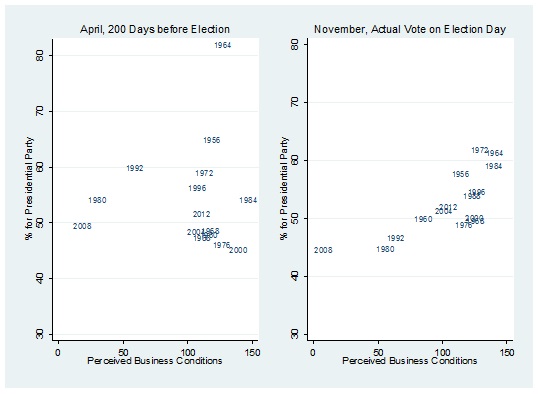
Perceptions at Each Point in Time
Next, we divide the daily trial-heat polls into the portion predicted from current economic perceptions and the portion that is not. We want to observe how the spread of the daily predictions changes over the timeline, which tells us how economic forces and other issues come to matter to voters. For this exercise, Figure 2 illustrates the variance of the daily readings of the predicted values (economy) and the residuals (other factors) by day, for the final 200 days of the election cycle—the point at which we have polls including the two final candidates in the 15 election years.
Figure 2: Variances of from the Two Components of Daily Polls: The Parts Predicted by Economic Perceptions and Other Sources.
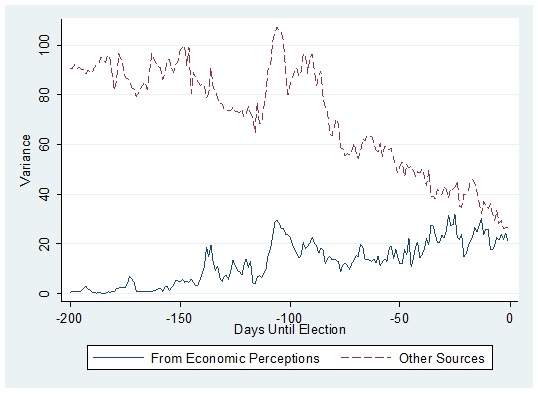
In Figure 2 noneconomic factors dominate at the outset of the campaign, but then decline over time. Meanwhile, the economic variance—the portion of trial-heat polls explained by economic perceptions—is small at the beginning of the campaign but grows over time. It almost catches up with the noneconomic variance by the end of the timeline.
How do we interpret this pattern? Early in the election year, survey respondents are not paying much attention to the economy when they answer pollsters’ questions about how they will vote. But they take into account other things, such as their views of the current administration and early perceptions of the eventual presidential candidates. As the campaign proceeds, noneconomic considerations become less important in voters’ minds, especially partisanship. Meanwhile, the economic cue increases in salience and matters more in the aggregate.
Predicting the Vote from the Economy over the Campaign Timeline
So far, we have daily poll readings and we can account for the portion determined due by economic perceptions and the remainder due to other factors, but which is more important in terms of predicting the Election Day vote? To see, we analyze the actual presidential party vote on the daily economy-based poll prediction and the residual portion of the polls. Figure 3 traces the portion of the Election Day variance in the vote that can be explained by each component over the campaign timeline.
Figure 3: Proportion of the Variance in the Election Day Vote Explained by Daily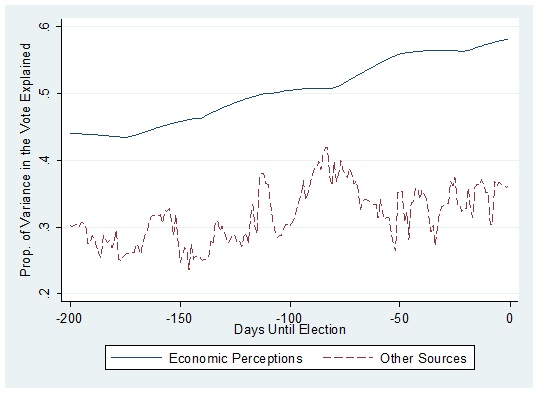
Readings of the Economic and Noneconomic Components of Trial-Heat Polls
Figure 3 shows that both components of the trial-heat polls explain an increasing portion of the variance in the vote. The later in the campaign, the more you can predict from current preferences. Note that the portion of the polls that reflects the economy is the better predictor of the Election Day vote. This is true from the beginning of the campaign until the end. In other words, if one could determine how much the trial-heat polls were influenced by economic perceptions, that portion would be far more helpful for an Election Day prediction than the portion predicted by other factors.
Let us summarize. Early in presidential campaigns, voters are not incorporating economic evaluations into their electoral preferences; the economy has little impact on presidential polls of the moment. But early-campaign economic perceptions are predictive of the national verdict on Election Day. At the same time, we see that the portion of voter preferences that is not due to the economy has its impact, too.
Suppose you want to predict a US presidential election at various points along the campaign timeline. Over time, trial-heat polls offer increasing forecasting power, as they increasingly reflect both the economic and noneconomic fundamentals. But for forecasting purposes, it is helpful to consider the trial-heat polls as well as what people are thinking at that moment about the national economy. This is especially true well before Election Day. It also is true on Election Eve, as final pre-election polls do not fully reflect the state of the economy (or other, noneconomic fundamentals).
This article is based on the paper “Forecasting US Presidential Elections Using Economic and Noneconomic Fundamentals” appearing in the PS: Political Science and Politics symposium on US Presidential Election Forecasting. Click here to read the other posts in this series.
Featured image – Credit: diamondduste (Creative Commons: BY-NC-ND 2.0)
Please read our comments policy before commenting.
Note: This article gives the views of the author, and not the position of USApp– American Politics and Policy, nor of the London School of Economics.
Shortened URL for this post: http://bit.ly/1i0rH65
_________________________________________
Robert S. Erikson- Columbia University
Robert S. Erikson is Professor of Political Science at Columbia University. He is co-author of The Timeline of Presidential Elections (University of Chicago Press), The Macro Polity (Cambridge University Press), and American Public Opinion (Pearson).
Christopher Wlezien- University of Texas, Austin
Christopher Wlezien is Hogg Professor of Government at the University of Texas at Austin. He is coauthor of Degrees of Democracy (Cambridge University Press) and The Timeline of Presidential Elections, and currently is Associate Editor of Public Opinion Quarterly.