 The 2016 presidential election is well over two years away and there is much we do not know about how the race will unfold. The candidates, economic conditions, and just about everything else are factors that have not yet been determined. Drawing on elections from the past sixty years, James E. Campbell argues that the 2016 race will almost certainly fall within a 45-55 percent split, and is likely to be even closer. He writes that such close races are good for election forecasters because it is more difficult to be too far off from the actual vote, but that the compressed outcomes can unrealistically raise the expectations of forecast accuracy.
This article is part of a collaboration with the PS: Political Science and Politics symposium on US Presidential Election Forecasting. Click here to read other posts in this series.
With more than seven months to go before this year’s midterm elections and more than two and a half years before Americans elect President Obama’s successor, at risk of understatement, there is a great deal that we do not know about what the political landscape for the 2016 presidential election will look like. Although former First Lady, U.S. Senator, and Secretary of State Hillary Clinton is widely regarded as the Democratic Party’s likely standard-bearer, just about everyone also thought this in 2008 and we all know how that turned out. The Republican presidential field is wide open. New Jersey Governor Chris Christie, who many handicappers regarded as the favorite, has stumbled badly in scandals involving snarling traffic and other petty political vendettas. The GOP’s field of potential and plausible candidates beyond Christie is lengthy. Then there is the economy. Having sputtered throughout President Obama’s entire term, will it finally get back on track by the election year? Finally, between now and then any number and kind of natural to man-made disaster, domestic or international, can intervene. Think Hurricane Katrina in 2005 or the Wall Street Financial Meltdown of 2008. There is a political eternity between the spring of 2014 and the fall of 2016.
While there is much about the 2016 race we do not know, there are a couple of critically important things that we do know. These have helped form the basis for several successful presidential election forecasting models and, even at this early date, provide a firm basis for concluding that whoever wins the 2016 presidential election will do so by a narrow margin. All should anticipate a tight race, down to the wire.
Presidential elections are usually closely fought, but there are two reasons to think that 2016 will be especially tight. First, despite all the post-2012 gloating by Democratic pundits that demographic shifts of a growing non-white electorate are building to a new Democratic majority, presidential elections since the late 1980s have been and promise to continue to be very narrowly decided contests. Despite demographic shifts, the political parties remain near parity in party identifiers. Despite claims to the contrary, the nation is highly ideologically polarized and has only become more so in recent years.
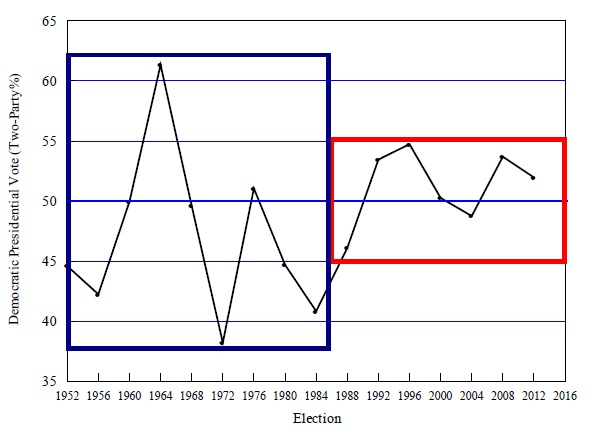
As Figure 1 shows, the mix of partisan parity reinforced by ideological polarization has compressed election outcomes into a narrower range of possibilities. In presidential elections from 1952 to 1984, the Democratic candidate’s share of the two-party vote ranged as high as 61 percent (Johnson in 1964) to as low as 38 percent (McGovern in 1972). Three of the ten elections were landslides and another (Eisenhower in 1956) came close. Since 1984, every election has been within the 55-45, there have been no landslides, not even close to one.
Figure 1: The Narrowing Margins of Presidential Elections, 1952-2012
 The second early fundamental for 2016 involves presidential incumbency. Presidential incumbency is a considerable advantage. Open seat elections take place on more level playing fields. Like those for every other office, open seat contests for the presidency are usually tighter races and 2016 will be an open seat election.
Figure 2 offers a comparison of the Democratic presidential vote when an incumbent is running and when the contest is for an open seat. Like recent polarized party parity elections (say that three times quickly), the vote division window is about half the size for open seat contests. One must go back over sixty years (1952) to find an open seat election outside the 55-45 spread. Three of the six open seat races were decided by razor-thin margins and one of the three more clearly decided elections (2008) became so because of a historic financial system collapse within weeks of the voting.
Figure 2: Closer Vote Margins in Open Seat Presidential Elections, 1952-2012
 The open-seat versus incumbent race split in Figure 2 actually slightly understates a major distinction in presidential elections. Not all incumbents enjoy the same advantages. First-party term incumbents—those seeking a second consecutive term in the White House for their party—are nearly invincible, with eleven wins and one loss (Carter in 1980) since 1900. Other incumbents, those seeking to extend their party’s presidential tenure beyond a second term (e.g., President Ford in 1976 and the first President Bush in 1992) are in positions more akin to open seat combatants. When first party-term incumbent elections are compared to all other races (open seats plus those with multi party-term incumbents), the standard deviation of the Democratic vote is cut by more than half in the open seat and multi party-term incumbent races. It drops from 7.8% in the eight first-party term elections to only 3.2% in the eight open seat and multi party-term contests.
The likelihood of a tight election may have some interesting implications for the election forecasting of 2016. For the forecasts generally, there is good news and bad. The good news is that it should be more difficult for a forecast to be too far off the actual vote. A smaller box of plausible outcomes should constrain prediction errors (assuming the forecast is of a plausible vote within the 55-45 spread). The bad news is that compressed political outcomes may raise expectations of forecast accuracy, perhaps unrealistically. No forecast can be expected to be perfect. There are just too many imperfections in the elements that go into any model (polling errors, continually revised economic data, etc.), plus the many un-anticipatable idiosyncratic developments in every campaign.
Still, once the political fundamentals take a more definite shape in the months leading up to the election, the stronger election forecasting models should be able to zero in more tightly on which side of the smaller vote division box voters will settle into. Which are the stronger forecasting models? Track records provide some indication; but beyond that, look to forecasts that provide simple and plausible explanations of why they should work. If an explanation of a forecast seems too convoluted or contrived or buried in arcane mathematics to be believed, then you probably shouldn’t believe it.
This article is based on the paper “Issues in Presidential Election Forecasting: Election Margins, Incumbency, and Model Credibility” appearing in the PS: Political Science and Politics symposium on US Presidential Election Forecasting. Click here to read the other posts in this series.
Featured image – Credit: scriptingnews (Creative Commons: BY-SA 2.0)
Please read our comments policy before commenting.
Note: This article gives the views of the author, and not the position of USApp– American Politics and Policy, nor of the London School of Economics.
Shortened URL for this post: http://bit.ly/1lCfLqb
_________________________________________
James E. Campbell- University at Buffalo, SUNY
James E. Campbell is a UB Distinguished Professor of Political Science at the University at Buffalo, SUNY. His main research interests are on American macropolitics. He is the author of three university press books and more than 80 journal articles and book chapters. His most recent book is The American Campaign: U.S. Presidential Campaigns and the National Vote. He is currently working on a book about the polarization of American politics.