

 The Great Recession saw large increases in unemployment and greater housing insecurity for many, which in turn led to increased take up of social safety net programs such as food stamps. In new research, Patricia M. Anderson, Kristin F. Butcher and Diane Whitmore Schanzenbach find that while households that are below the poverty line were largely shielded from additional hardships during the Great Recession, those with incomes just above it slipped through the cracks of the safety net, and experienced additional hardships.
Over the course of the Great Recession (GR), housing prices plummeted and unemployment more than doubled, sending many American households into economic distress. Not surprisingly, use of social safety net programs increased, but not simply due to falling incomes. Instead, even holding income level constant, program usage was higher after the recession hit, with usage patterns across income varying greatly by program. Participation in the Supplemental Nutrition Assistance Program (SNAP, aka food stamps) increased the most. Since SNAP primarily serves households below the poverty line, this group was most protected from additional hardship during the GR – although the levels of hardship faced by this group are relatively high even during good economic times.
Figure 1 uses the fraction of households classified as food insecure – a series of questions that measures whether households ran out of money to buy food in the previous month – to measure material hardship both before and after the GR, by income-to-poverty percentage. As can be seen, while the poor suffer from the most hardship, by this measure there was only a small increase after the GR. By contrast, households with incomes from about 150 to 250 percent of the poverty line, although better off than the poor, saw a marked increase in hardship with the GR. Note that few families above 300 percent of the poverty line report any food insecurity, so we limit our analysis to families with incomes below this threshold.
Figure 1 – Increase in Material Hardship by Income-to-Poverty Percentage, Before and After the Great Recession
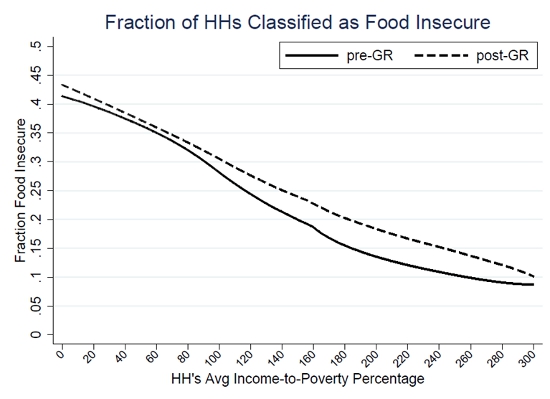
Source: Authors Calculations from Current Population Survey
The different impacts of the GR on the rate of material hardship can be explored by examining the role of safety net programs by income-to-poverty percentage. Figure 2 presents usage rates of four large cash (or near-cash) assistance programs, before and after the GR, by income. The four programs shown are SNAP (on the left axis, given its much larger scale), the Earned Income Tax Credit (EITC), Temporary Assistance to Needy Families (TANF) and Unemployment Insurance (UI). The blue SNAP lines reveal an essentially parallel shift up in usage up to about 150 percent of the poverty line, but very little increase in participation for families with incomes above that level. By contrast, the red EITC lines show increases across the distribution, but the largest are for those close to the poverty line. The green TANF lines are essentially indistinguishable, implying there was no increase in its use. Finally, the yellow UI lines are upward sloping — indicating higher use among higher-income families — with a mainly parallel shift in participation for families above the poverty line and smaller increases below.
Figure 2 – Usage Rates of Safety Net Programs by Income-to-Poverty Percentage, Before and After the Great Recession
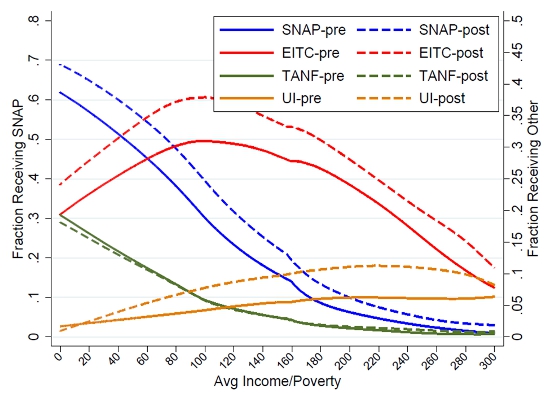
Source: Authors Calculations from Current Population Survey
SNAP is the main safety net program used by low-income households, and participation in the program increased especially for those below the poverty line during the GR, but to understand its role in insuring families against the economic shocks of the GR it is also important to consider the level of SNAP benefits. Figure 3 looks instead at program benefits as a fraction of adjusted income (including the value of benefits from transfer programs such as SNAP, EITC, free school lunches and energy assistance). The blue SNAP lines (left axis) make very clear that this program was important to the budgets of lowest-income households, especially after the GR. For most households below the poverty line, SNAP provided 5 percent or more of their resources before the GR, and about 10 percent or more after. For this group, though, Temporary Assistance to Needy Families becomes less important in the GR, as seen in the green lines (right axis). For example, for families at 60 percent of the poverty line TANF benefits that once made up 5 percent of total resources drop to only 4 percent with the GR. The exact opposite, however, occurs with the EITC (the red lines, right axis) which makes up a higher share of household income after the GR. Similar to SNAP, the size of the jump in benefit share is highest among households near the poverty line and declines quickly as family income increases. Only for the yellow lines of Unemployment Insurance is there a noticeable post Great Recession increase in share of income from safety net programs for households above the poverty line. UI provides a relatively small share of average household resources, peaking at only about 2.5 percent of total resources (up from under 1 percent prior to the GR) at about twice the poverty line.
Figure 3 – Share of Household Resources from Safety Net Programs by Income-to-Poverty Percentage, Before and After the Great Recession
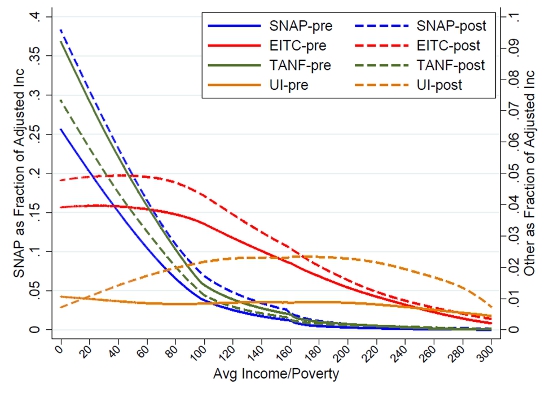
Source: Authors Calculations from Current Population Survey
Examining the role of safety net programs by income-to-poverty percentage makes clear that SNAP was by the far the most important component of the safety net in catching households during the GR. While households with income below the poverty line in the U.S. suffer high rates of material hardship even during good economic times, the safety net did help insure them against even worse outcomes during the GR. On the other hand, households with incomes that are relatively low but higher than the SNAP eligibility cutoff appeared to fall through the holes in the safety net, suffering large increases in material hardship as measured by reporting food insecurity during the GR.
This article is based on the paper ‘Changes in Safety Net Use During the Great Recession’, in American Economic Review: Papers & Proceedings 2015. Work in the paper was funded by the Russel Sage Foundation under award 92-12-09.
Featured image credit: U.S. Department of Agriculture (Flickr, CC-BY-2.0)
Please read our comments policy before commenting.
Note: This article gives the views of the author, and not the position of USApp– American Politics and Policy, nor of the London School of Economics.
Shortened URL for this post: http://bit.ly/1OuHAiH
______________________
Patricia M. Anderson – Dartmouth College
Patricia M. Anderson is Professor of Economics at Dartmouth College and a research associate at the National Bureau of Economic Research. Her research interests fall broadly in the field of applied microeconomics, with specific interests in child health and nutrition and in social insurance programs.
Kristin F. Butcher – Wellesley College
Kristin F. Butcher is the Marshall I. Goldman Professor of Economics at Wellesley College and Chair of the Department of Economics. She is a research associate at the National Bureau of Economic Research. Her research focuses on labor, migration, health, and education.
Diane Whitmore Schanzenbach – Brookings
Diane Whitmore Schanzenbach is the director of The Hamilton Project and a senior fellow at the Brookings Institution. She is currently on leave from her position as an associate professor in the School of Education and Social Policy at Northwestern University. She is also a research associate at the National Bureau of Economic Research, and a research affiliate of the Institute for Research on Poverty. She studies issues related to child poverty, including education policy, child health, and food consumption.