 While millions have signed up for health insurance under Obamacare since it launched in 2014, coverage across individual states has been uneven, with some signing up as many as 87 percent of those uninsured, while others signed up as few as 13 percent of those eligible. In new research which examines state by state differences in health insurance market boundaries, Michael Dickstein finds that when smaller counties were bundled with larger neighbors, insurers were more willing to enter the market, which is associated with lower premiums. They also find that those regions which have a mix of very high and low levels of urbanity were less attractive to insurers, and had higher premiums.
In 2014, nearly 8 million U.S. residents signed up for private health insurance coverage through new marketplaces created under the Affordable Care Act (ACA). According to a Kaiser Family Foundation estimate, this enrollment represented about 28 percent of the potential marketplace enrollment nationally. This national figure, however, masks vast differences in the share of the uninsured population that gained coverage in the first year across individual states. Vermont enrolled 87 percent of uninsured residents who lacked coverage through their employer or through public insurance programs. California enrolled 43 percent, while, toward the low end, North and South Dakota signed up only 13 percent of the eligible uninsured population.
Along with a team of researchers, I set out to examine the factors that drove the performance of the state marketplaces in their inaugural year. We found that the number of plans offered is related to the size of the health insurance regions specified by the state as well as the mix of urban and rural communities within regions.
For the market to function successfully, uninsured consumers need a choice of affordable plans in their area. We therefore looked at the decisions of insurers to offer plans as well as the level of the premiums they charged, particularly in rural markets. These small markets may attract fewer insurers, leaving consumers with few plan options and higher prices.
Our analysis focused on two central regulations of the insurance market under the ACA: “community rating” and “guaranteed issue.” Under community rating, prices may vary only by a very restricted set of characteristics, including age, family size, and whether the purchaser smokes tobacco. Premiums may also vary by geography—the term “community” refers to the geographic region within which the insurer must charge the same price. Under guaranteed issue, insurers must sell plans to all consumers who seek to purchase them, independent of any pre-existing illnesses. Regulators often bundle these two provisions, to prevent insurers from setting a community price but then rejecting all but the healthiest applicants for coverage. Under the ACA, lawmakers mandated guaranteed issue and community rating nationwide.
Lawmakers left the definition of a community, here known as a coverage region, to individual states. Each state could choose the number of regions and the geographic areas they each cover. This decision has important implications for market outcomes: drawing larger regions might attract more insurers to compete for the larger pool of potential customers, leading to more plan choices and possibly lower prices. Larger regions, however, could also pool together a diverse group of customers over a larger geographic area. Insurers might find this heterogeneous or dispersed population more costly to serve at a single price and therefore choose not to enter.
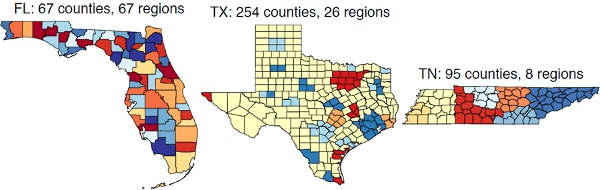
We exploit the state-by-state differences in the market boundaries to test how the market definitions affect both the level of premiums and plan availability. Figure 1 illustrates this variation for three states. At one extreme, Florida defines rating regions uniquely by county—there are 67 regions to cover the 67 counties in the state. Near the other extreme, Texas defines rating regions by using one region per major city and then a single region that covers all remaining counties in the state. Thus, Texas divides its 254 counties into only 26 regions. Tennessee defines regions with slightly higher numbers of counties per region than the average, but the counties within each region are geographically contiguous.
Figure 1 – Coverage maps in Florida, Texas and Tennessee
To isolate the effect of the rating region definition on pricing and entry, we examine those counties that are otherwise similar—in demographics and health market characteristics—but differ in whether or not they are bundled with a more populous county in their region. We focus on small and rural counties; these markets are most similar and are of policy interest because of the concern that insurers will not serve them. These 1,157 small and rural counties appear in Figure 2 with light shading.
Figure 2 – Variations in health insurance state market boundaries

White: No data; state-based exchange
Light gray: Satisfies cutoffs for small and rural designation
Dark gray: Above cutoff for small and rural designation
Note: To assess the early experience in the ACA marketplaces, we collected the premiums, financial characteristics, and associated insurance carrier for every health insurance plan offered on the healthcare.gov website. The website served as a platform for sales of marketplace plans in 36 states. Figure 2 highlights the states that offer plans via the federal platform. These states are largely in the South and Midwest. The excluded states, shown in white, include the major population centers in the West and the Northeast. We define small and rural markets as those with population and urbanity below the 75th percentile in population—around 37,000—and below the 50th percentile in urbanity, about 40 percent urban.
To illustrate our approach, we return to an example from Tennessee. In Figure 3, we highlight four counties within Tennessee: two small, rural counties, Fayette and Cannon, and two larger, urban counties, Shelby and Rutherford. Fayette and Shelby counties share a border in the southwest of the state; Tennessee officials drew the region boundaries in a way that bundled the two counties into Region 6. Thus, in both counties the same four insurers operate and consumers face the same benchmark premium of $3,396.
Figure 3 – Comparison of benchmark premiums in rural and urban counties in Tennessee
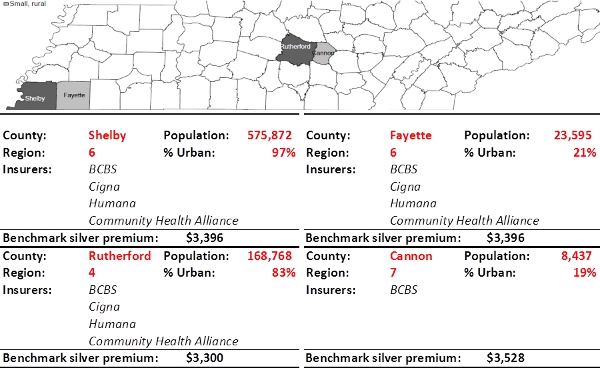
Note: the benchmark premium is the price of the second-cheapest silver tier plan available to consumers in the market. The dollar values in this example are for a 51-year-old single adult
In the center of the state, Cannon and Rutherford counties share a boundary but were bundled into distinct regions. The larger Rutherford County, placed in Region 4, attracted four insurers to serve the individual market, with a benchmark premium of $3,300. The smaller Cannon County in Region 7 attracted only one insurer, and consumers faced a benchmark premium of $3,528, 7 percent more than the premiums faced in the bordering urban county. Cannon County consumers face a benchmark premium that is also 4 percent more than the otherwise comparable Fayette County, which officials bundled with its urban neighbor.
We repeat this within-state, small county comparison in a regression framework, to add controls for county-level demographics and health market characteristics. In this analysis, we find a significant increase in the number of insurers entering those small counties that were bundled with their larger neighbors. Specifically, being grouped in a region with a large urban county increases the number of entrants by an average of between .6 and .8 insurers. The bundling is also associated with an average decrease in annual benchmark premiums of between $200 and $300 in the rural counties. Bundling rural counties with larger, more urban neighboring regions appears to have a meaningful effect on the supply of plans available to rural residents.
These findings raise the question: should government regulators choose larger region sizes, to include entire states or maybe multiple states, as in Medicare Part D? At the extreme, why not establish one nationwide market for insurance in which insurers can choose to participate?
The experience of existing regions of different sizes can inform the likely outcome under such a region definition. We compare regions that differ in population size, density, and the degree of urbanity. Across these regions, we focus on counties that have similar patient demographic profiles and similar costs of medical care provision, so that the comparison isolates the effect of region size.
We find a clear trade-off in the designation of a region’s boundaries. While an increase in the population of the region is associated with greater numbers of insurers offering plans and lower premiums for the benchmark plans, more heterogeneous regions appear to have lower degrees of competition and higher premiums. That is, for the same population level, regions that have pockets of extremely high and low urbanity appear relatively unattractive markets for private insurers to enter, possibly due to greater costs needed to serve such markets. Thus, market outcomes may worsen with larger region sizes.
This article is based on the paper ‘The Impact of Market Size and Composition on Health Insurance Premiums: Evidence from the First Year of the Affordable Care Act’, in American Economic Review: Papers & Proceedings 2015.
Image credit: Chris Potter, stockmonkeys.com (CC-BY-2.0)
Please read our comments policy before commenting.
Note: This article gives the views of the author, and not the position of USAPP – American Politics and Policy, nor of the London School of Economics.
Shortened URL for this post: http://bit.ly/1F0szp0
_________________________________
Michael Dickstein – New York University
Michael Dickstein is an Assistant Professor of Economics in the Department of Economics at the Stern School of Business at New York University. His research interests include health economics, industrial organization and econometrics.