 With the 2016 presidential primary now well underway, many pundits and commentators are beginning to cast their minds towards the fall general election. But what is the best way to predict the outcome? Andreas Graefe argues that given the plethora of models and forecasting methods which are available, the best option is to combine all the approaches into one forecast. Using this combined approach – which has been accurate over the last three presidential elections – the PollyVote.com currently predicts that a Democrat would win nearly 53 percent of the two-party vote in November, while a Republican would gain just over 47 percent.
Most people think of polls as the main way to predict election results. The idea of this approach is straightforward: ask people for whom they are going to vote on November 8th and then use the aggregated results as a forecast of what is actually going to happen. Strictly speaking, however, such vote intention polls do not provide forecasts. They measure public opinion at a particular point in time. The problem with interpreting polling results as forecasts then is that people’s vote intention may change over time, in particular if the election is still far away. Apart from errors caused by sampling problems, non-responses, inaccurate measurements, and faulty processing, changes in public opinion is likely a major reason why polls are among the least accurate methods for forecasting elections months in advance.
Fortunately, there are alternative methods that are useful for long-term election forecasts. For example, one usually gets much more accurate forecasts by obtaining people’s expectations of what is going to happen, rather than collecting their vote intentions. This can be done by simply asking experts (or even regular citizens) who they think is going to win, an approach that has been successfully used at least since the 1930s. Another approach are so-called prediction (or betting) markets, which allow people to bet on the election outcome and use the resulting odds as forecasts.
Another valuable approach is to develop quantitative forecasting models based on theories of voting and electoral behavior. For example, there are many models that predict US election outcomes based on the idea of retrospective voting, which assumes that voters reward the incumbent party for good, in particular economic, performance and punish it otherwise. Other models rely on the idea of prospective voting, for example, by assuming that voters decide based on which candidate they expect to do a better job in handling the issues or leading the country.
Each of these different prediction methods use a different approach, rely on different data, and are subject to different biases. The question then, is which method or forecast one should rely on? This is a tough decision to make. In most forecasting situations, it is difficult to determine which method will eventually prove most accurate. Election forecasting is certainly no exception in that regard, in particular, if the election is still far away. The reason is that every election is held in a different context and has its idiosyncrasies. Therefore, methods that worked well in the past may not necessarily work well in the future. For example, while prediction markets were among the most accurate methods for forecasting the US presidential elections from 1992 to 2008, they did not do well in 2012. In other words, choosing the method that has provided the most accurate forecasts in previous elections may result in poor forecasts for future elections.
Luckily, you do not have to make that decision. In fact, a large body of evidence from forecasting research that has accumulated over almost half a century advises you against relying on a single method or forecast. Instead, the best means to reduce forecast error is to combine the different forecasts. Combining forecasts increases accuracy because the approach allows for including more information than any individual method, and because the combined forecast cancels out the bias of individual methods. In general, while combining is useful whenever more than one forecast is available, the approach is particularly valuable if, first, many forecasts from evidence-based methods are available, second, the forecasts draw upon different methods and data, and, third, there is uncertainty about which method is most accurate. As described above, these conditions perfectly apply to election forecasting.
Since 2004, PollyVote.com has demonstrated the benefits of combining forecasts for election forecasting by averaging forecasts within and across different methods, namely polls, prediction markets, expert judgment, citizen forecasts, and quantitative models. Across the last three US presidential elections, PollyVote’s final forecast missed the final election outcome on average by little more than half a percentage point. In comparison, the respective error of the final Gallup poll was more than three times higher. PollyVote’s performance is even more impressive for long-term forecasts, when polls are of only limited value. In each of the three elections from 2004 to 2012, PollyVote has correctly predicted the election winner months in advance, and more accurately than any other method.
Figure 1 – PollyVote 2016 forecast of the national popular two-party vote
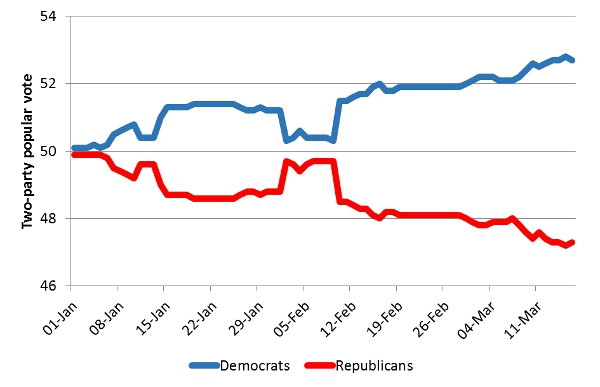
For the 2016 election, PollyVote currently predicts the Democrats to win 52.7 percent of the national popular two-party vote, compared to 47.3 percent for the Republicans. Interestingly, there is some disagreement among the component methods. While the econometric models that rely on retrospective voting have the Republican Party in the lead, the remaining six component methods predict the Democrats to win.
This reveals another important benefit of PollyVote: its educational aspect. In collecting and aggregating forecasts from different evidence-based methods, the platform provides a valuable source for those interested in election forecasting, allowing readers to learn about different methods and to compare their forecasts.
Featured image – Credit: diamondduste (Creative Commons: BY-NC-ND 2.0)
Please read our comments policy before commenting.
Note: This article gives the views of the author, and not the position of USAPP – American Politics and Policy, nor the London School of Economics.
Shortened URL for this post: http://bit.ly/254A3ku
_________________________________
Andreas Graefe – LMU Munich, Columbia University & Macromedia University
Andreas Graefe is a research fellow at the Tow Center for Digital Journalism at Columbia University and at LMU Munich’s Department of Communication Studies and Media Research. He also holds the endowed Sky Professorship in Customer Relationship Management at Macromedia University. Andreas leads the PollyVote.com project and is a (co-)developer of several election forecasting models.