 Under the Supplemental Nutrition Assistance Program (SNAP), the US government provides food assistance to those who need it. While the SNAP caseload increased markedly following the great recession, Caroline Danielson writes that this was actually a continuation of a trend which had begun in 2000. She argues that worsening local and state economies contributed to the increases in SNAP take-up that we have seen in the past 16 years, and that as the economy strengthens, the number of SNAP recipients should fall.
While it may come as little surprise that the take-up for the largest food assistance program in the United States—the Supplemental Nutrition Assistance Program, or SNAP—grew rapidly after the Great Recession, what is less well recognized is that this growth was underway well before the downturn began. Between 2000 and 2007, the number of SNAP recipients increased by about 50 percent. The caseload grew by another 70 percent over the next 5 years, reaching about 14 percent of the entire U.S. population in 2011. The program peaked at 47.6 million recipients in 2013 and began declining slowly in 2014 and 2015. As Figure 1 shows, the current number of recipients is still above the levels of 2011 and earlier years.
Figure 1 – SNAP grew most strongly during and after the Great Recession
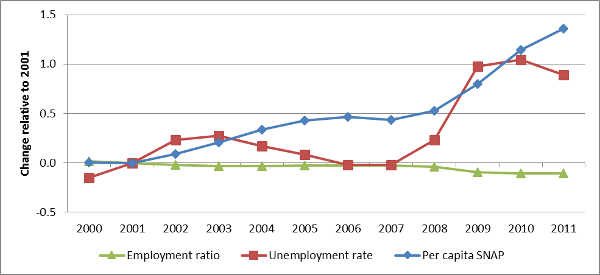
Sources: Food and Nutrition Service, U.S. Department of Agriculture; Bureau of Labor Statistics; Census Bureau.
Note: National annual averages shown.
SNAP is intended to support adequate access to food. To qualify for SNAP, applicants must show that they have low monthly incomes. If they qualify, individuals and families receive an ATM-like card that is loaded monthly with their benefit amount (that varies depending on family size and income). This EBT card can be used to buy groceries, seeds, and—for a few recipients in a few areas that have adopted this option—prepared meals. Many aspects of the program are uniform nationwide, but some are specific to states, such as efforts to reduce paperwork in order to increase access for those who are eligible but not enrolled in SNAP.
This growth in the caseload is well-known. Still, several aspects of the growth are perhaps surprising. First, growth in SNAP receipt is much larger than changes in the main cash assistance program for families with children (Temporary Assistance for Needy Families, or TANF). Second, while the number of recipients certainly exploded between 2008 and 2009 in sync with the business cycle, the caseload also grew strongly before the start of the Great Recession.
Thus there is an open question about the extent to which a weak economy is a comprehensive explanation for SNAP caseload growth. Policy changes—and in particular aspects of the program that states have under their control—could also lie behind the growth. This set of factors drove some of the debate in 2013 around the most recent reauthorization of the Farm Bill. These debates centered on whether SNAP receipt should be more tightly linked to work and whether state eligibility rules have become too broad. The enacted bill made relatively minor changes, cutting the program by roughly 1 percent. Are policymakers then right to be concerned that SNAP receipt is permanently higher because of policy changes?
Earlier research has investigated the question of the role of the economy, but our research revisits the question in light of the experience of the Great Recession. We also assess whether considering local economic conditions strengthens our understanding of the interplay of SNAP and the economy. We explicitly consider state policy changes, but do not separately distinguish the temporary boost in benefits included as part of the 2009 American Recovery and Reinvestment Act (ARRA) and that lapsed in 2013.
Measuring the economy that workers actually face is important. To a great extent, labor market options are shaped by where one lives. Monetary and non-monetary costs of moving are high (and may be even more of a barrier those with low incomes). At least for larger states the relevant local labor market is not the entire state, but instead a smaller region that may well cross state lines (for example the New York City area). We consider economic conditions at such a regional level (termed “Labor Market Areas” by the US Bureau of Labor Statistics), as well as at the state level.
The unemployment rate is an important summary measure of the state of the economy for workers. However, given the phenomenon of discouraged workers (adults who stop looking for work in poor economic times), the ratio of employment to (working age) population is additionally informative. For example, Figure 1 shows that the unemployment rate began to improve before employment did. We consider both.
We find consistent evidence that both local and state economies matter, although—surprisingly—state economic conditions are more strongly associated with caseload changes than are regional measures. We find mixed evidence that states saw increases in their caseloads in the wake of adopting policies to increase access to, and broaden eligibility for, SNAP–and conclude that such changes are at best a partial explanation for the caseload increase we have seen so far in the 2000s. In contrast, as Figure 2 shows, the economy accounts for roughly a quarter of the pre-recession increase and three-quarters of the increase during and after the Great Recession.
Figure 2 – Share of SNAP increase accounted for by a worsening economy
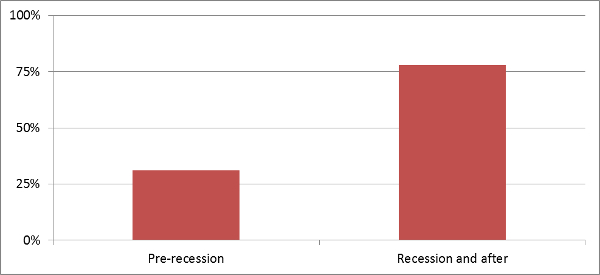
Source: Klerman and Danielson (2015) Can the Economy Explain the Explosion in the SNAP Caseload?
Notes: “Pre-recession” period refers to 2001-2007, when the caseload grew by 53%. “Recession and after” period refers to 2007-2011, when the caseload grew by 71%. Simulations hold unemployment rate and employment ratio constant at their pre-period most favorable values. Preferred model specification—that includes two measures of economic conditions, lagged values of these measures, state-level policies and linear trends to adjust for non-economic state-level changes—used in simulations.
All in all, our research points to a substantial role for the economy in determining the size of the SNAP caseload. Policymakers, then, should expect that the high levels of SNAP receipt seen during and after the Great Recession will continue to drop in response to the strengthening economy. However, our research also suggests that the number of SNAP recipients will drop gradually, so that the unwinding of the caseload increase will occur over several years. And when the US experiences another economic downturn, the number of people receiving SNAP assistance will rise once again.
Featured image credit: U.S. Department of Agriculture (Flickr, CC-BY-2.0)
Please read our comments policy before commenting.
Note: This article gives the views of the author, and not the position of USAPP – American Politics and Policy, nor the London School of Economics.
Shortened URL for this post: http://bit.ly/1RS1W8e
_________________________________
Caroline Danielson – Public Policy Institute of California
Caroline Danielson is a senior fellow at the Public Policy Institute of California. Her research focuses on multiple dimensions of the social safety net, including its role in mitigating poverty, program access and enrollment, and the integration and governance of programs.