 As the 2016 election season rolls on, it is looking increasingly likely that former Secretary of State Hillary Clinton will square off against New York billionaire Donald Trump in the general election. But what determines how voters decide which candidate to support? Scott Armstrong and Andreas Graefe have developed a bio-index model that predicts presidential election outcomes based on candidates’ biographies by capturing information such as a candidate’s family history, education, or political experience. The model predicts that Hillary Clinton would beat Donald Trump by a landslide, gaining nearly 60 percent of the vote.
The state of election forecasting has progressed to the point where it is possible to develop highly accurate forecasts for major elections, in particular if one combines forecasts from different methods that use different information. However, one area that has received little attention is the use of forecasting as an aid to those involved with political campaigns. For example, methods such as traditional polls (which ask people for whom they are going to vote) or prediction markets (which aggregate people’s expectations of how the election will likely turn out) can merely tell you who is in the lead, but not why.
To answer the ‘why’ question, scholars have long developed so-called political economy models to test theories about voting behavior, which they would then use to predict election outcomes. Most of these models rely on the idea of retrospective voting, according to which a presidential election is a referendum on the incumbent president’s job performance or, more narrowly defined, his ability to handle the economy. Aside from economic measures (such as GDP growth, unemployment, or inflation) and polls, many models also include a measure of how long the incumbent party has held the White House in order to account for voters’ well-known desire for change. These models have made important theoretical contributions to our understanding about how the so-called ‘fundamentals’ shape the election outcome. Their practical usefulness is limited, however. After all, during an election campaign, incumbents can neither influence the state of the economy nor their time in office. It is thus difficult for political parties and candidates to take action based on such forecasts.
Models with decision-making implications
This was the reason why, in 2008, we embarked on a project that aimed to develop models that have implications for political decision-makers. Our work resulted in the development of the Issue-index, a model that predicts presidential election outcomes based on how voters expect the candidates to handle the issues. The model can thus advise candidates which issues they should emphasize in their campaign. This initial work later led to two related models, namely the Big-issue and the Issues and Leaders model.
Bio-index model for presidential election prediction
Another result of this endeavor was the bio-index model, which predicts presidential election outcomes based on candidates’ biographies. In providing forecasts conditional on who the candidates might be, the model can thus help parties to decide who they should nominate. In addition, candidates could use it to decide whether they should run for office in the first place.
Developing our forecasting model
We used the index method – which has a long history in forecasting and decision-making and whose origins can be traced back at least to Benjamin Franklin – to develop our forecast model. The index method is a structured approach that works similar to a checklist. That is, the method asks analysts to, first, prepare a list of key variables and, second, code them based on prior knowledge about their directional influence on the outcome. In our case we would assign a score of 1 if a variable has a positive impact on a candidate’s chance to win the election, and 0 otherwise. Then, after coding each candidate on each variable, we would simply sum up the scores using equal weights and predict the candidate with the higher total bio-index score to win the election.
The bio-index model uses 58 biographical variables that are expected to influence a candidate’s change of being elected. The selection and coding of the variables was guided by findings from prior research that analyzed which factors make people emerge as (political) leaders. Popular examples include intelligence and height, which meta-analyses found to have a positive impact on leader emergence, or a person’s facial competence and attractiveness, which have also been shown to predict electoral success. Other examples are birth order (politicians are more likely to be a single child or first-born) or the experience of traumatic or adverse events in childhood, such as a chronic disease of the loss of a parent. In addition, we added some variables based on common sense. For example, we assumed that the American electorate is more attracted to candidates who are married and never divorced, and have children.
Forecasts for the 2016 presidential election
So, what does the model predict for 2016? When comparing the current frontrunners in both parties, Hillary Clinton and Donald Trump, the model forecasts Clinton will win the election, with a bio-index score of 18 points (compared to Trump’s 10). We then calculated vote-share forecasts by regressing the incumbent’s two-party vote share on his relative bio-index score, using data from all historical elections since 1896. The corresponding forecast predicts Clinton to win by a landslide, with 58.8 percent of the two-party vote, compared to 41.2 percent for Trump.
We also coded other potential candidates (at pollyvote.com, you can also code your own candidates or see how the forecast changes if you change our coding). Figure 1 shows a selection of possible 2016 match-ups between the remaining Republican and Democratic candidates. According to the bio-index model, Trump would be the worst possible candidate for the Republican party but the model also predicts Clinton to defeat Kasich. For a hypothetical Clinton-Cruz race, the model predicts a virtual tie.
Figure 1 – Bio-index model vote-share forecasts for possible 2016 match-ups
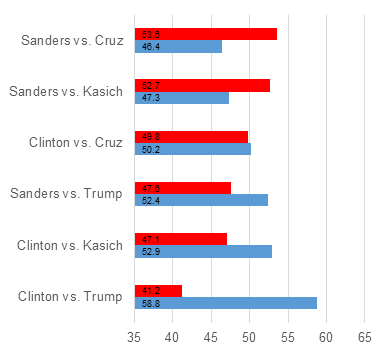
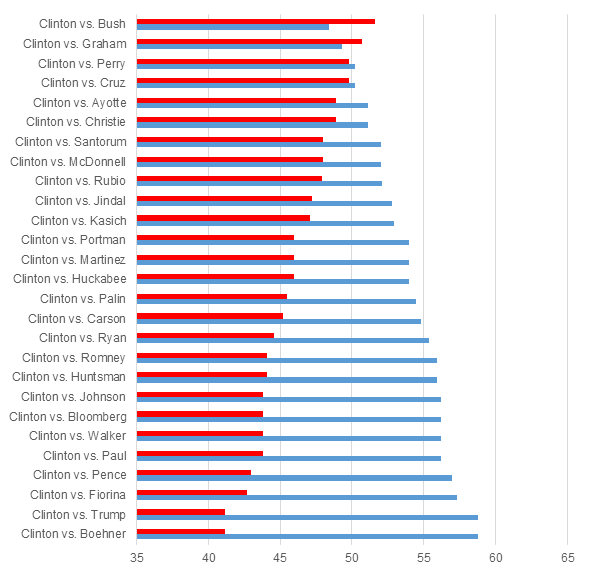
Figure 2 shows the bio-index model’s forecasts for Clinton vs. other candidates. Again, Trump (along with John Boehner, who never ran for president) stands out as the worst possible candidate. In comparison, Clinton performs well compared to the vast majority of potential opponents. In fact, there are only two candidates of those we coded that the model would predict to defeat Clinton: Jeb Bush and Lindsey Graham, both of whom have already dropped out of the race.
Figure 2 – Bio-index model vote-share forecasts for match-ups between Clinton and hypothetical Republican candidates
Past performance of the model
Figure 3 shows the model’s predicted (in-sample) and actual percentage point lead in the two-party vote for the winners of the 30 elections from 1896 to 2012. If both the grey and the orange bars are on the right hand side of zero, the model correctly predicted the final election winner.
As can be seen, the model’s forecasts failed only two times: it wrongly predicted Ford to beat Carter in 1976 as well as Bush to defeat Clinton in 1992. For the remaining 28 elections, the model correctly predicted the winner. The forecast for the 2012 election, published in August 2011, correctly predicted Obama to defeat Romney.
The more critical test, though, is how well the model predicts the candidates’ popular vote-shares. Across the six elections since 1992, the model’s ex ante forecasts missed the final vote shares on average by 2.7 percentage points, which is 13 percent lower than the typical error of eight established political economy models that provided forecasts for that time period.
Figure 3 – Predicted and actual vote-share lead for election winner (1896-2012)
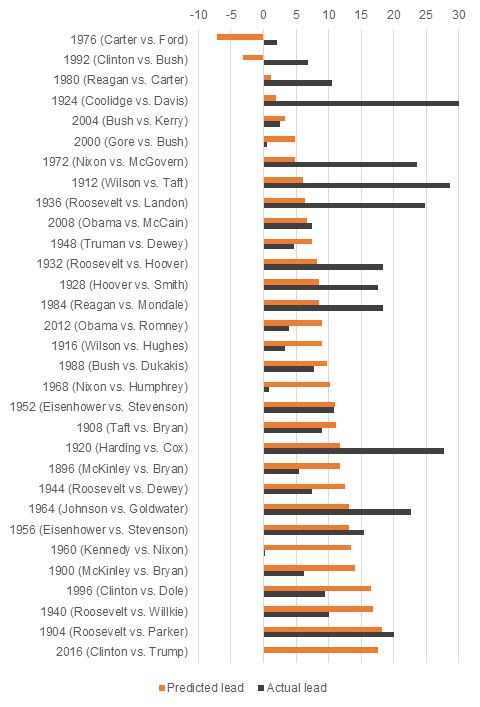
Figure 3 also puts the model’s 2016 forecast in historical perspective. The predicted 18-point lead for Clinton over Trump is the second largest margin ever. The only case in the model predicted an even bigger lead is the 1904 election between Theodore Roosevelt and Alton Parker. Theodore Roosevelt eventually won that election with an even bigger margin of 20 percentage points.
Some caveats
As any model, the bio-index is subject to limitations. For example:
- The bio-index model ignores many factors that are also important for predicting election outcomes. Examples include information about the state of the economy, the time the incumbent party has held the White House, the perceived ability to handle issues, or the effectiveness of the advertising campaigns.
- The model forecasts, which were wrong for 1976 (predicted Ford) and 1992 (predicted Bush), indicate a certain bias towards experience. This is obvious, given that the model is based on the assumption that prior experience is a predictor of leader emergence.
- The 2016 election will most likely be the first male-female race for president in US electoral history. In this situation, we did not code some variables (e.g., height, weight) since their predictive validity is unclear.
That said, the model’s major aim is not to produce the most accurate forecasts possible. If this is what you are looking for, check out the PollyVote forecast. Instead, the major goal of the bio-index was to provide decision-making implications by advising parties on who they should nominate. In addition, we wanted to develop a model that uses different data than existing models and can thus provide new insights.
Given the predicted 18-point lead for Clinton in a hypothetical race against Trump, the model’s implications are clear: Donald Trump would be the worst possible choice for the Republican Party.
Featured image credit: DonkeyHotey (Flickr, CC-BY-SA-2.0)
Please read our comments policy before commenting.
Note: This article gives the views of the author, and not the position of USAPP – American Politics and Policy, nor the London School of Economics.
Shortened URL for this post: http://bit.ly/1qYlBuO
_________________________________
J.Scott Armstrong – Wharton School of the University of Pennsylvania
J. Scott Armstrong is a Professor of Marketing at the Wharton School of Business at the University of Pennsylvania. His research interests include, forecasting, marketing, strategic planning, public policy and organizational behavior. He is a co-founder of the Journal of Forecasting, International Journal of Forecasting, International Institute of Forecasters, International Symposium on Forecasting, and PollyVote.com.
Andreas Graefe – LMU Munich and Columbia University
Andreas Graefe is a research fellow at LMU Munich’s Department of Communication Studies and Media Research and the Tow Center for Digital Journalism at Columbia University. Andreas is also a caretaker of the PollyVote.com and a (co-)developer of several election forecasting models.