 With environmental concerns on the rise, many US states have introduced policies to reduce waste, including taxes on packaging. In new research using a case study of the introduction of a bottled water tax in Washington State, Andrew Stevens finds that such taxes have far less of an impact than was originally expected. For an average tax increase of 9 percent, consumers only reduced consumption of bottled water by 6 percent. Other policies, such as deposit and refund systems, he writes, are far more effective in reducing plastic bottle waste and litter.
When Washington Governor Christine Gregoire proposed a statewide tax on bottled water in 2010, one of her main goals was to reduce plastic bottle litter. As it turned out, the tax was more effective at raising tax revenue than it was at reducing bottled water sales. This recent case study teaches an important lesson about environmental regulation: taxes do not always have as big an effect on consumer behavior as we may expect. If the ultimate policy goal is only to reduce pollution, other approaches may be more effective than a tax.
Policymakers today generally understand that bottled water is bad for the environment. Lightweight polyethylene terephthalate (PET) bottles are energy-intensive to produce, and frequently wind up as litter in waterways and oceans. In fact, plastic beverage bottles are the second-most-common type of ocean litter.
In response to water bottles’ environmental costs, municipalities across the United States have adopted different policies aimed at reducing plastic bottle litter. For instance, California and Oregon both have a five-cent deposit-and-refund recycling program. Taking a different approach, in 2008, the city of Chicago enacted a five-cent-per-bottle tax on bottled water. Finally, some colleges and universities are looking to ban bottled water from their campuses entirely.
This brings us back to Washington’s 2010 tax on bottled water. Introductory economics teaches us that when a product is taxed, consumers buy less of it. That’s the easy part. It is much more difficult to correctly quantify the size of this effect. In a recent paper, this is exactly what my co-authors and I do: we precisely analyze how Washington’s statewide tax on bottled water affected consumer behavior.
Prior to 2010, bottled water was exempt from Washington’s sales tax. Once the state legislature approved Gregoire’s proposed budget, however, it became taxable, just like most other consumer goods. This meant that on June 10, 2010, bottled water was suddenly subject to a tax of anywhere from 6.5 to 9.5 percent, depending on the local sales tax level.
The American Beverage Association quickly responded, gathering signatures to create Initiative 1107 – a ballot measure that would repeal the bottled water tax. In November 2010, voters decisively passed the initiative. The tax officially expired on December 1, 2010.
Washington’s unusual timeline provides a rare opportunity to study both the introduction and removal of a tax. Together with my co-authors, I analyze weekly store-level sales data of bottled water at a large, national retailer. We calculate the difference in bottled water sales in Washington stores before and after the new tax, and compare that number to the difference in bottled water sales in comparable Oregon and Idaho stores – where there was no new tax – before and after Washington’s tax. We also control for seasonality, weather, store-specific characteristics, shelf prices, and promotions.
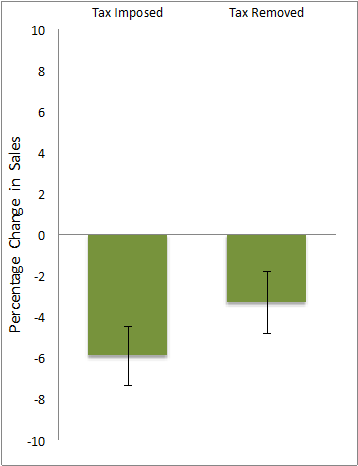
We find that, when bottled water was taxed in Washington, total sales decreased by 5.9 percent relative to the pre-tax period. Furthermore, when the tax was later rescinded, total sales remained 3.3 percent below pre-tax levels. Figure 1 summarizes these findings. The solid black line in the center of each bar represents a 95 percent-confidence interval for each estimated effect.
Figure 1 – Percentage change in Washington bottled water sales relative to the pre-tax period
It is particularly interesting to note that consumer demand for bottled water did not fully rebound to pre-tax levels in the post-tax period. There are several conceivable explanations for this behavior. First, it is possible that, during the tax period, consumers mentally internalized higher prices for bottled water and did not completely readjust when the tax was removed. Second, it is possible that the political narrative around taxing bottled water raised awareness about PET bottles’ negative environmental effects. Consumers may have internalized those messages and reduced their demand for water in plastic bottles. In either case, our results suggest that a consumer tax can have a persistent effect on sales even after it is removed.
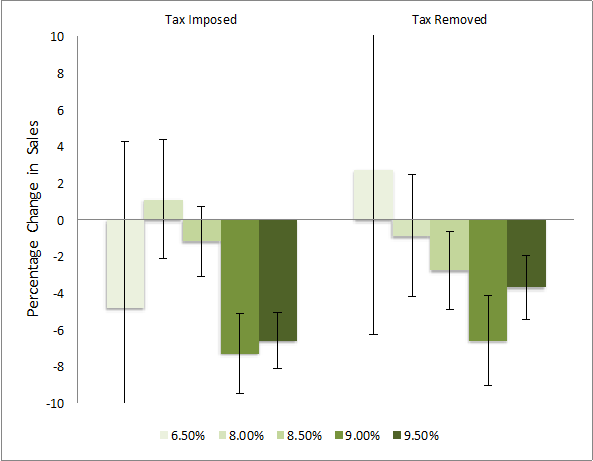
We also look at whether different tax rates had different effects. Figure 2 presents our estimates of how consumers responded to the tax for each observed tax rate. The first thing to note is that the results in Figure 1 are driven by consumers in areas with higher tax rates. In particular, in areas where the tax rate is 9 percent or 9.5 percent, consumers reduce their purchases of bottled water by 7.3 percent or 6.6 percent, respectively. Figure 2 tells a similar story for the removal of the bottled water tax: consumers in high-tax areas continue to buy less bottled water compared to the pre-tax period while consumers in low-tax areas do not seem to respond to the tax (or its removal) much at all.
Figure 2 – Percentage change in Washington bottled water sales relative to the pre-tax period
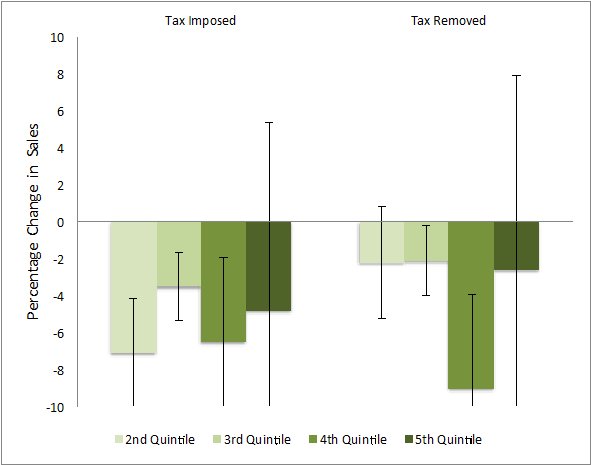
Finally, we look at whether the tax on bottled water had different effects in high- vs. low-income areas. Figure 3 presents these results, splitting up our sample into national income quintiles. First, since relatively few of the stores in our data are located in fifth-quintile areas, our estimates for the top income group are statistically imprecise. Second, the lack of consumer “rebound” after the tax is removed seems to be driven almost entirely by consumers in areas with fourth-quintile incomes. These upper middle class households may be particularly responsive to the environmental messaging that initially accompanied the bottled water tax.
Figure 3 – Percentage change in Washington bottled water sales relative to the pre-tax period
Overall, our analysis shows that, for an average tax increase of approximately 9 percent, consumers reduced their consumption of bottled water by only about 6 percent. In economics-speak, this implies that demand for bottled water is inelastic. Put simply, this means a tax on bottled water is more effective at raising tax revenue than at reducing bottled water sales.
In contrast to Washington’s tax, refund schemes like California’s deposit and refund system are specifically targeted to controlling litter and are much more effective and efficient at achieving that goal. For instance, in California, nearly 70 percent of all PET bottles sold in the state are redeemed for a refund. The money for these refunds comes from the 30 percent of bottles sold that are not redeemed. For only cents per bottle, California achieves a 70 percent redemption rate while a 9 percent tax in Washington only reduced bottle sales there by 6 percent. (What’s more, a reduction in sales is not the same as a reduction in litter!) If the policy objective is solely to reduce PET bottle litter, a consumer tax is a poor mechanism to achieve that goal.
The take-away lesson is clear: choosing the “right” environmental regulation depends on the policymaker’s ultimate goal. While in most situations, taxes may be the least distortionary policy from an economic perspective, they may not always have as large an effect on consumers’ behavior as one would hope.
This article is based on the paper, ‘Measuring Consumer Responses to a Bottled Water Tax Policy’, in the American Journal of Agricultural Economics.
Featured image credit: Kevin Doncaster (Flickr, CC-BY-2.0)
Please read our comments policy before commenting.
Note: This article gives the views of the author, and not the position of USAPP – American Politics and Policy, nor the London School of Economics.
Shortened URL for this post: http://bit.ly/2h38d7e
_________________________________
Andrew Stevens – University of California, Berkeley
Andrew Stevens is a PhD Candidate in Agricultural & Resource Economics at the University of California – Berkeley. His research focuses on agricultural production, environmental and natural resource management, food systems, and public policy. He has most recently been published in the American Journal of Agricultural Economics, and his work has been featured in the Economist, the Guardian, and on National Public Radio.