
Like many others we were frustrated about the absence of both reliable and (almost) real-time economic indicators about the true state of the economy post-Brexit. Survey data was plentifully available, but often contradicted itself, and appeared to be heavily biased towards the political leaning of the sponsor. Hence, we decided to look for a truly independent and reliable indicator, which we found in the electricity demand in England and Wales.
The beauty is that data on electricity demand is publicly available on an hourly level, as is data on many of the factors that explain much of the electricity demand, namely weather.
As we are after an indicator of economic activity, we will need to control for those factors that are determined by external factors. The most obvious one is weather, as for example cold weather will mean more electric heating. Public holidays are another one of those factors, as is the typical demand on let’s say a Friday in late November. After controlling for these and many other factors we end up with what we call ‘residual demand’, hence that demand that is driven by economic activity. We are facing an additional problem, as the economy appears to become more energy efficient over the last few years. We attribute this to the popularity in LED lights, and their superior efficiency.
Economic activity comprises services and manufacturing. Variation in service levels will have – in the short run – little impact on electricity consumption. In contrast, different levels in manufacturing activity will be highly visible in electricity consumption.
We updated this paper with the latest data on the 10th of each month, and we are planning to do so for the foreseeable future. We will publish the results below here, but will also keep the analysis of the past months up here for reference.
We are also updating our full paper every month. In the paper, ‘Turning on the light: assessing the impact of Brexit using electricity demand as a proxy’, we have created a model which predicts electricity demand on a typical day, in a typical week of any year using the pre-referendum behaviour. We then compare the observed demand with the predicted levels. But before we show these results, let us show the observed uncorrected electricity demand in England and Wales since January 1st, 2010 (Figure 1).
Electricity demand is highly cyclical with the seasons, but it also started to fall in the past few years with improved efficiency. The electricity demand is in log scale. One dot represents the demand per day.
Figure 1: Uncorrected electricity demand
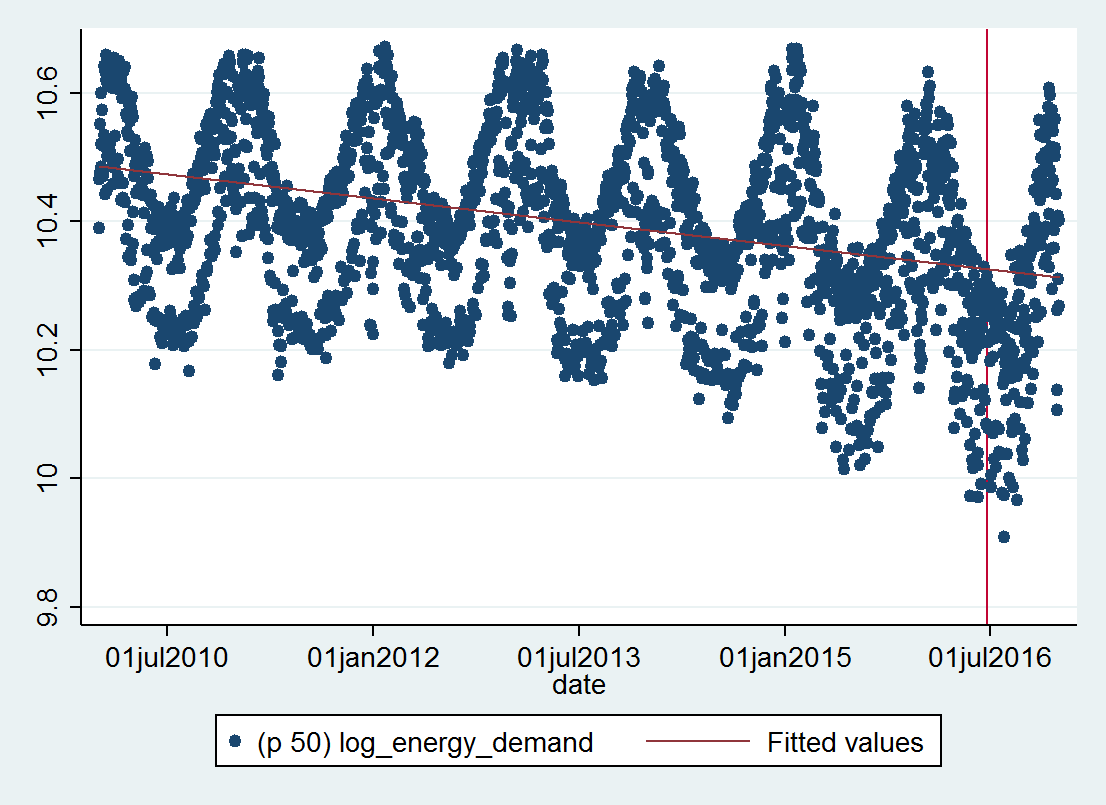
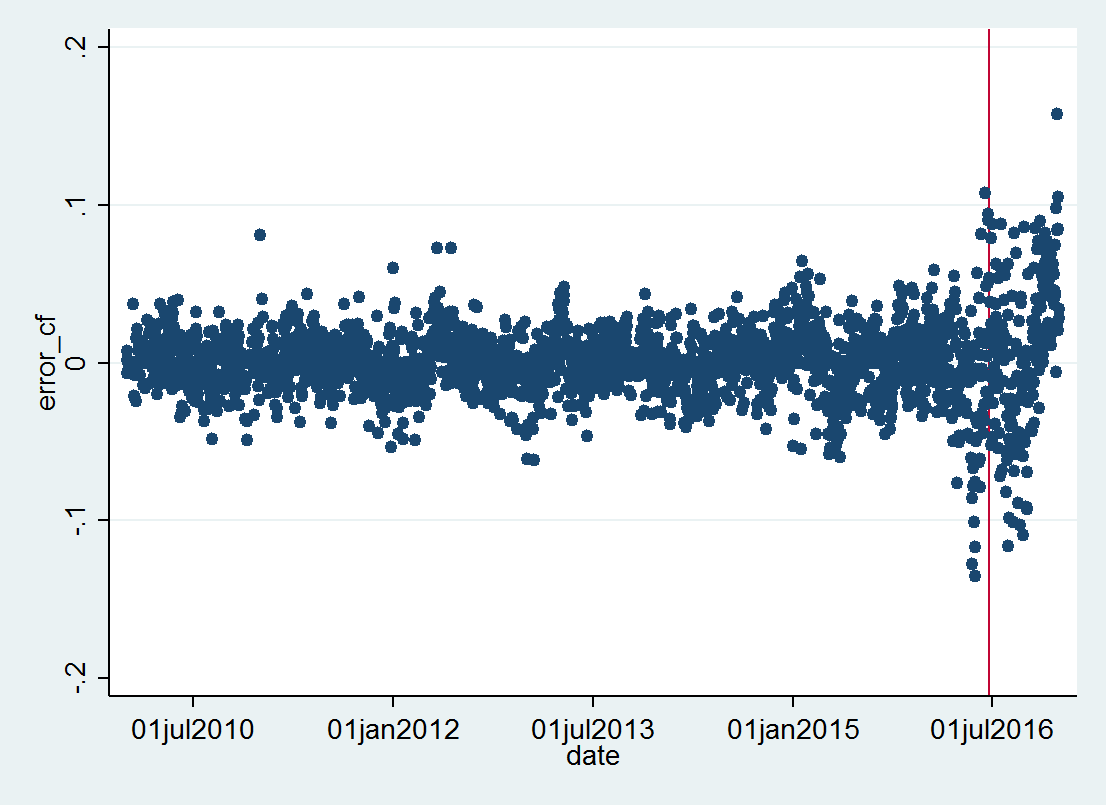
Figure 2 below depicts the difference between the observed and predicted demand. We observe that the error is very constant leading up to the Brexit vote on June 23th (red vertical line). In the weeks leading up to the vote electricity demand, and hence manufacturing activity, undershot and essentially continued to do so until December when we observe a noticeable catch-up effect, and above the long-term trend.
Figure 2: Observed vs. predicted
We believe that our measure is more timely than comparative measures published by the Office for National Statistics (ONS), and derived from very objective base data. Overall it compares well with the results published by the ONS, which show a 1.1 per cent slowdown in industrial production when comparing October 2016 with October 2015, and an increase of 2 per cent for November.
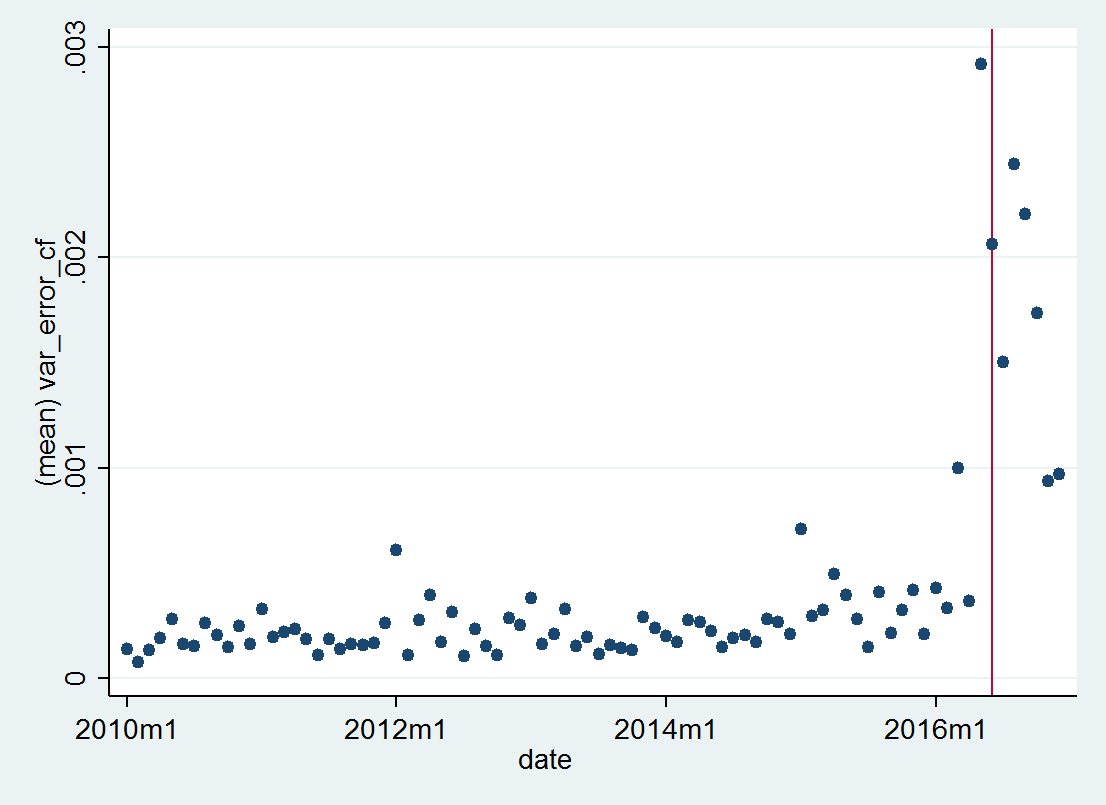
Finally, we can use the daily error in our prediction to calculate a monthly uncertainty index. We see that the uncertainty peaked just before the vote, and has now noticeably come down and stabilised over the last two months, albeit on a higher level (Figure 3).
The uncertainty index is calculated using the variance of the daily error for that month, and can be interpreted similar to the VIX index in (US) financial markets. The VIX index is commonly known as the fear index.
Figure 3: Economic uncertainty
♣♣♣
Notes:
- This blog post is based on the authors’ paper Turning on the Light: Assessing the Impact of Brexit Using Electricity Demand as a Proxy
- The post gives the views of its authors, not the position of LSE Business Review or the London School of Economics.
- Featured image credit: Electric lines in the sky, by Jonas Boni, under a CC-BY-2.0 licence
- Before commenting, please read our Comment Policy.
 Tom Kirchmaier is a Researcher in LSE’s Financial Markets Group (FMG) and Deputy Director of Corporate Governance at LSE. He is interested in using large firm-level datasets (Big Data) in improving the productivity and effectiveness of firms (both financial and non-financial) and other public organisations, and to provide practical use cases to operationalise his findings. Datasets he currently exploit are on policing, corporate boards, automotive supply chains, retail, and pricing.
 Nerea Ruiz de Gauna de Santiago is a Research Assistant at the Centre for Economic Performance (CEP) working with Tom on questions of policing, Brexit, and other policy relevant topics.