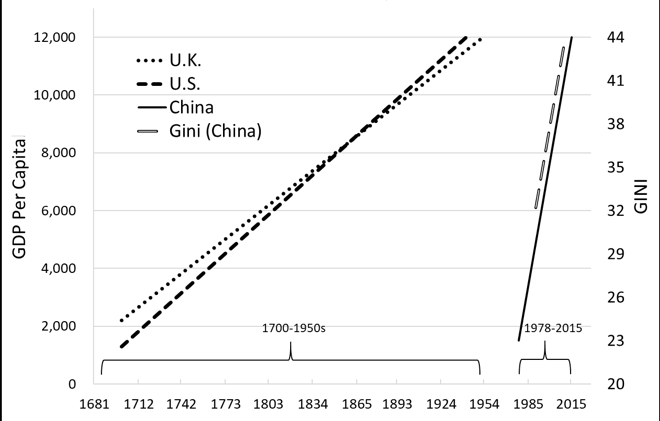
The transformation of China from a poor and egalitarian country to an upper middle-income country with the level of income inequality greater than in the United States has been the subject of innumerable publications. The Chinese transformation is a unique event in world economic history: never have so many people over such a relatively short period of time increased their income so much. China’s GDP per capita in 1978, at the time of the initiation of rural reforms, was about $1,500; by 2015, it was more than $12,000 (both in constant PPP dollars, data from the 2018 update of the Maddison Project Database.). For comparison, UK GDP per capita was (expressed in the same units) around $12,000 in 1953, while its GDP per capita at the beginning of the Industrial Revolution is estimated at more than $3,000. Thus, it took the UK about a century-and-half to increase its GDP per capita by half as much as China did in less than 40 years (see Figure 1).
Figure 1. GDP per capita in the UK, US, and China (2015 PPP dollars)
Such transformation is only superficially captured by synthetic indicators like GDP per capita, Gini coefficient or the share of the top one per cent (Kanbur and Zhang, 2018; Zhuang and Shi 2016; Ding and He, 2018; Wu and Perloff 2008; Yang, Piketty and Zucman 2018). The experienced social changes were much deeper (changement en profondeur) and affected all social classes. The composition and characteristics of the elite, a topic with which we are concerned, were almost completely overhauled.
Our objective is to describe and analyse the change in the Chinese economic elite between (approximately) the years of early reforms and the attainment by China of the status of largest economy in the world (in PPP terms). We are interested in how the composition and characteristics of the top income group in the urban area have changed during that period. Our analysis relies on the nationally representative household income surveys – China Household Income Project (CHIP) – which were drawn from a much larger sample of Urban Household Survey (UHS) conducted annually by the National Bureau of Statistics (NBS). We use urban samples of four CHIP waves in 1988, 1995, 2002, and 2013. The surveys are fundamentally comparable although each of them does display certain idiosyncrasies that we have to “iron out” in order to make the variables of interest fully harmonised. The richness of the survey information in CHIP allows us to analyse various features of the urban elite (defined as the urban top five per cent income group), and the evolution of these characteristics over time and across regions. The characteristics which we shall discuss here are three: share of total urban income received by the elite, elite’s social composition, and CCP (Chinese Communist Party) membership.
Inequality
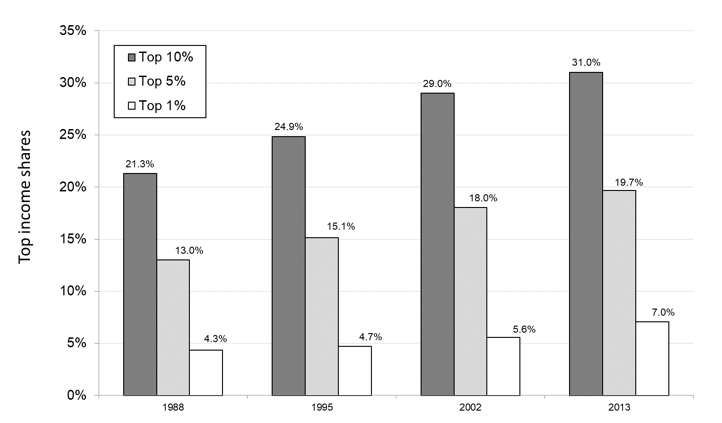
The income shares of the three top groups increased between 1988 and 2013 (Figure 2). The top one per cent share went up from 4.3 per cent in 1988 to seven per cent in 2013; the share of the elite (top five per cent) increased from 13 per cent to almost 20 per cent, and the share of the top decile increased from about 21 to 31 per cent. Similarly, inequality calculated across all adults, and measured by the Gini coefficient, rose from 0.27 in 1988 to 0.45 in 2013. This is an unsurprising result simply confirming what other studies of inequality (cited above) have also found.
Figure 2. Income share of the top one, five, and ten per cent
Social structure
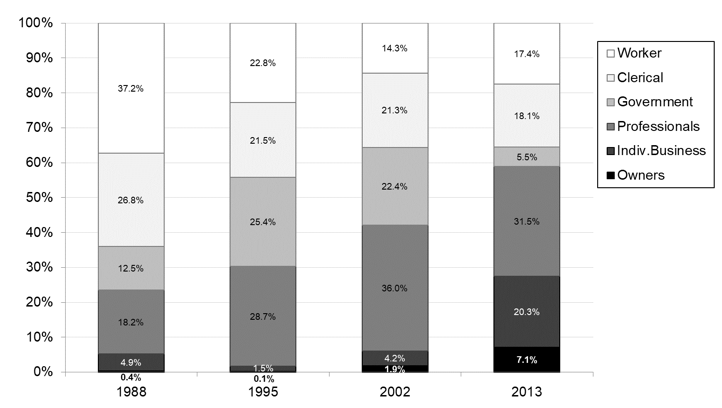
A new question we ask is whether the social composition of the elite has changed and how. The surveys distinguish six social groups or classes: workers, clerical and office employees, government administration (at all levels), professionals, owners of individual businesses (including the self-employed) and larger-scale owners. There was a major shift in the composition of the elite toward the two latter (capitalist) classes (Figure 1). In 1988, they accounted for barely three per cent of all elite members. Then their share doubled to about six per cent by 2002, and “exploded” in the next decade, increasing more than three-fold to reach almost 20 per cent in 2013. This speed of social change in China may be contrasted with a recent finding by Bob Allen (2017), who, using standardised social tables for England and Wales, from Gregory King’s 1688 table to Dudley Baxter’s in 1867, found that it took capitalists almost two centuries to more than double their share in population, passing from 3.4 per cent in 1688 to 7.8 per cent in 1867.
The Chinese urban elite, which before the important urban reforms in the early 1990s was overwhelmingly composed of workers, clerical staff and government officials — the three classes accounting for three quarters of the people in the top 5 per cent in 1988 — has by 2013 become an elite in which professionals and business owners are in the majority.
Figure 3. Social composition of the top five per cent (percentage of individuals)
Chinese Communist Party membership
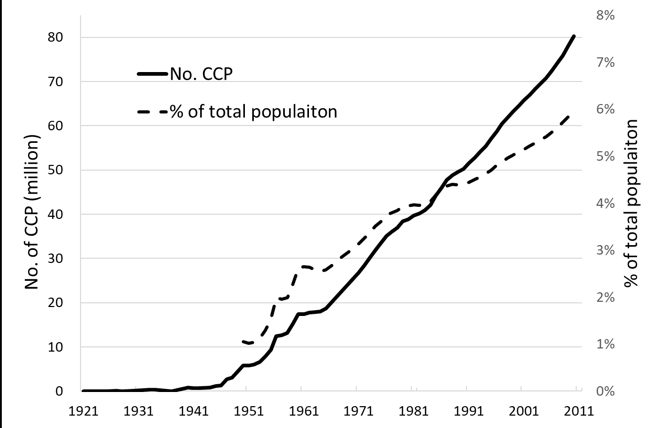
The Chinese Communist Party (CCP) has been growing dramatically since it was founded in 1921. There were only 57 members in 1921; by the year of 1988, there were about 49 million, accounting for five per cent of total population in China; in 2010, the number of CCP members reached 80 million, accounting for 13 per cent of total population (see Figure 4).
Figure 4. Growth of the Chinese Communist Party since 1921
An interesting question in a de facto single-party state is how much political influence or connections help increase income. It is especially intriguing in China, where the ruling party is officially concerned with the interests of the poorer or less educated sections of the population, but where the observed changes clearly paint a picture of rising importance of the well-educated professionals and entrepreneurs.
The share of party members among the elite (the top ten, five and one per cent) increased continuously between 1988 and 2002, and then dropped rather precipitously between 2002 and 2013. By 2013, the share was lower than at the beginning of the period. Both the levels and the evolution of the share are very similar for the top five and one per cent. As Figure 5 illustrates, at its peaks, CCP membership in both elite groups exceeded one-half, and among the top one per cent it reached almost 60 per cent. But by 2013, CCP members were only one-third of the top five per cent and slightly under one-quarter of the top one per cent.
Figure 5. The share of communist party members among the elite

However, CCP members who are in the top one per cent are nowadays relatively richer, compared to the average income of the rest in the top one per cent (Figure 6). In all the years prior to 2013, the relative income of CCP members was about the same as the relative income of other members of the elite, whether we look at the group that comprises percentiles 91-95, percentiles 96-99, or the top one per cent But In 2013, there was a significant increase in CCP members’ relative income in the highest income group.
Figure 6. Income of communist party members of the elite groups compared to the average income of all elite members
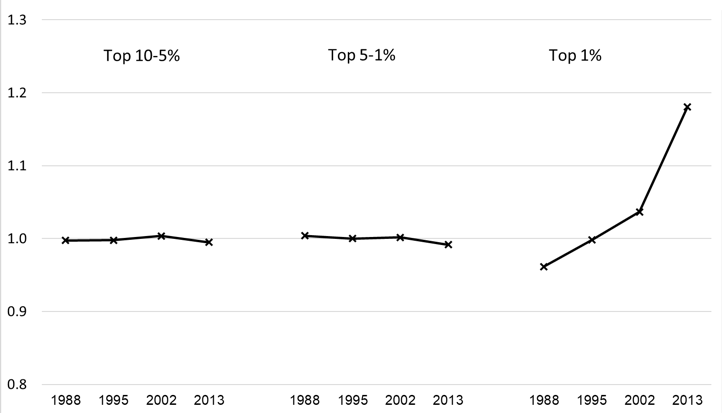
Note: The graph shows the average income of CCP members who are part of percentiles 91 to 95 (left), percentiles 96 to 99 (middle) and the top percentile (right) relative to the mean income of that group. Value of 1 indicates that average income of CCP members is the same as the average income of the group (and hence also to the average income of non-Party members).
In general, we find (not shown here) that while professionals’ and workers´ shares in urban CCP membership approximate closely their population shares, professionals who are party members have become much more numerous among the top five per cent, while workers have become much rarer. In other words, whereas the structure of the overall communist party membership in the recent period reflects better the population structure than in 1988, the party top is moving further away from both CCP overall class composition and from that of the urban population as a whole. This might have important political consequences.
This result acquires additional significance when we find in a regression analysis that private-sector businessmen who are part of the elite and are also communist party members tend to receive a very large premium from their party membership (34 per cent). This is in contrast with all other social groups to whom CCP membership, once they are elite members, is not financially important. It is also noteworthy that we found no evidence of this large party membership premium for private-sector businessmen in the years before 2013.
Conclusion
Chinese economic, and as we argue here, social transformation during the past four decades is without a historical precedent. Urban areas have become much richer, but also much more unequal. The elite, which we define here as the top per cent of the urban population, receives a much greater share of total urban income than in 1988. The majority of the elite today consists of professionals, self-employed, and smaller and larger businessmen (while workers and clerical staff were in the majority in 1988).
Finally, we find that almost a third of the elite are members of the Chinese Communist Party, and that membership seems to be quite valuable in monetary terms to those in the top one per cent as well as to large capitalists. It should be mentioned, however, that CCP membership might also proxy for greater ability and ambition — not necessarily only for better political connection (Zhang 2007). But without further study it is difficult to disentangle the two.
♣♣♣
- The post gives the views of its author(s), not the position of LSE Business Review or the London School of Economics.
- Featured image by Peiyu Liu, under a CC-BY-NC-2.0 licence
- When you leave a comment, you’re agreeing to our Comment Policy
 Li Yang is a postdoctoral researcher at the Paris School of Economics (PSE) and coordinator for East and Southeast Asia at the World Inequality Lab (WIL). He’s interested in wealth and income inequality, economic development and economic history. Email: li.yang@psemail.eu
 Filip Novokmet is a post-doctoral researcher at the University of Bonn’s Institute for Macroeconomics and Econometrics.
 Branko Milanovic is centennial professor at LSE’s Inequalities Institute, a visiting presidential professor at the Graduate Center of the City University of New York and an affiliated senior scholar at the Luxembourg Income Study (LIS) and the Barcelona Institute for International Studies. In 2019 he was appointed the honorary Maddison chair at the University of Groningen. Formerly, Milanovic was the lead economist in the World Bank’s research department.