How is it possible that global stock markets rally and grow in size while the real economy, comprised of everything else that is non-financial, hits the doldrums? Smita Roy Trivedi uses tools of technical analysis to show the extent of the current rally and writes that bubble bursts, though unpredictable, unfailingly happen.
The global equity indices have been big, fat and unhealthy for some time now. After the first pandemic-induced lockdown, global equity indices shot up to ‘infinity and beyond’ even while the real economy (comprised of the non-financial sectors) wrestled with an economic downturn. It seemed that the euphoria in the financial markets was comfort food to escape from the depressing downturn.
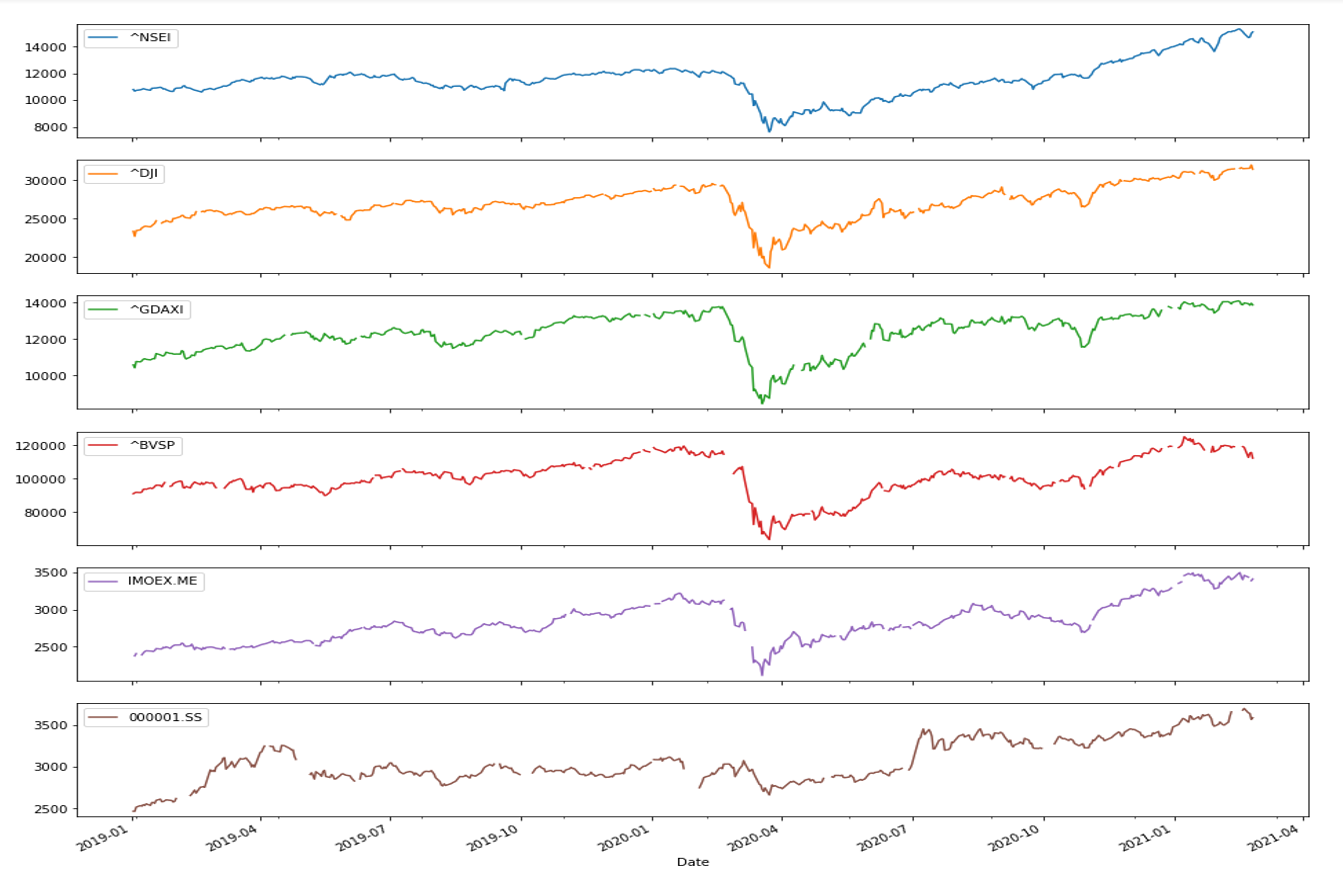
From April 2020 to February 2021, the Dow Jones Industrial Average climbed up by 9989 points, the Shanghai Stock Index 775 points and the Nifty (India) by 6275 points. The rally bloated the markets, while the real economy shrivelled. By 2021, stocks were in an epic bubble, with asset prices growing delinked to fundamentals. Moreover, the pattern has remained the same across the globe: the figure below shows this mirroring effect for the Nifty 50 India (^NSEI), Dow Jones, US (^DJI), Deutscher Aktien Index, Germany (^GDAXI), Bovespa Index, Brazil (^BVSP), MOEX Russia Index (IMOEX.ME) and SSE Composite Index, China (000001.SS)
Figure 1. Global equity indexes after the outbreak of the pandemic

Source: Author
This explosive financial market growth is symptomatic of a deeper malaise: the process of financialisation that has characterised the global economy for some time now. Financialisation is reflected in financial sector growth delinked to real economy developments. There is evidence that financialisation has deteriorated capital accumulation, driven normal rate of profit upwards, led to shareholder primacy, stagnant wages, income inequality and uneven geographical development.
However, financialisation, or its impact on the real economy, is the last thing market players will pay heed to in a euphoric market. The growing chasm between financial and real sectors makes such neglect feasible. How is it that stock markets have been able to grow irrespective of the economic nosedive? The linkage between the massive liquidity drive that central banks have doled around the world and the euphoric stock-market movements deserves more discussion in this context.
But the present stock market growth is worrying for market players, even when we close our eyes to the impact on the real economy. By its metrics, the market is at the overbought extreme. Let’s analyse the stock market independently of the fundamentals, a common practice amongst market participants. Technical analysis studies markets considering only trading activity: price and volume. It concentrates on spotting trend reversals so we know when to buy low and sell high. Technical analysis indicators help us to see the strength (momentum) in the price increase or decline so that we can buy an oversold stock (and expect prices to rise) and sell an overbought stock (and wait for prices to fall). What do these indicators tell us of the current markets?
Let’s look at markets’ most adored (and abused) measure of momentum: the Relative Strength Index, which looks at how much prices have increased over the last 14 trading periods compared to the decrease. If the magnitude of price increase is at least 2.33 times the decrease, RSI values shoots beyond 70 showing an overbought market. It rests on the fundamental belief that when markets are overbought, prices have increased too sharply, so the “longs” will use the opportunity to liquidate positions and take profits. For traders this is the right time to ‘take profits’, for investors the right time to secure financial goals. That is why when a market is overbought we can predict a halt and finally a reversal of the rally (uptrend), as traders and investors liquidate their positions.
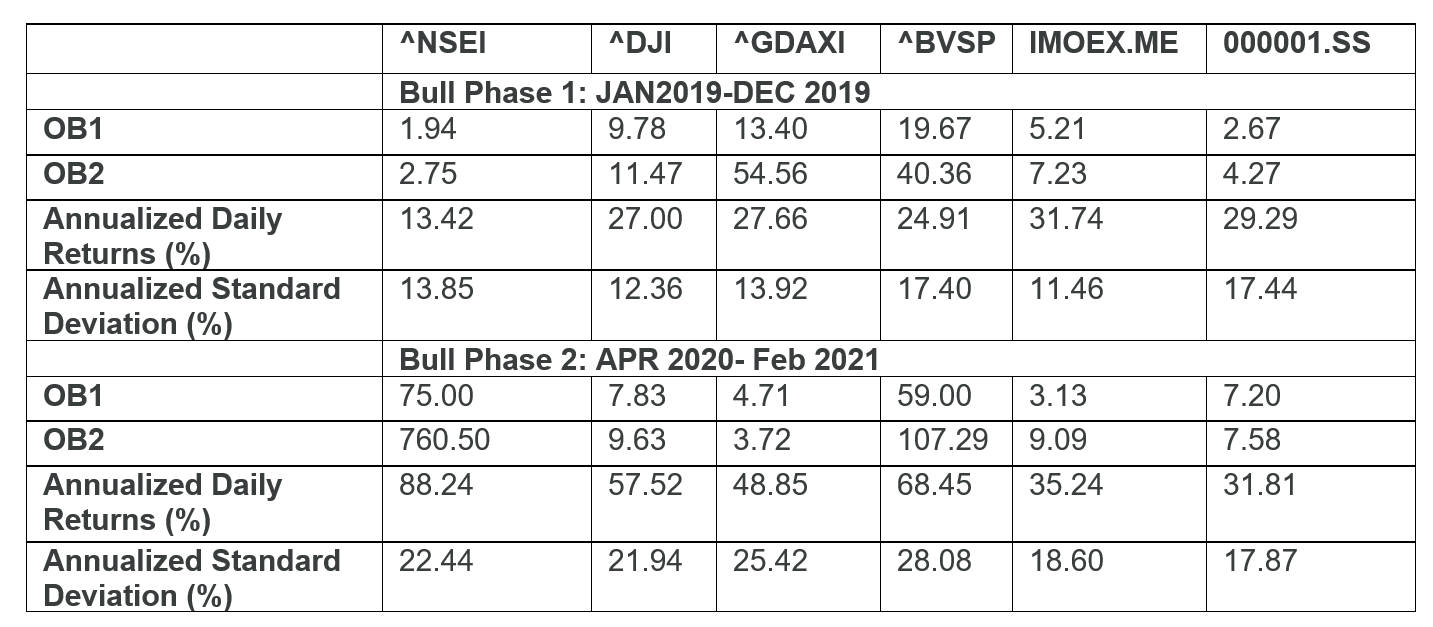
To what extent are markets now overbought? We present two simple metrics: first, the ratio of number of days markets are overbought (OB) to number of days it is oversold (OS), which we call OB1. Second, OB2 is the ratio of the extent of “overbought to oversold”, where extent of OB (OS) is the absolute value of the Relative Strength Index above 70 (below 30). We compare the two bull runs (skipping the bear market, January to March 2020) as RSI during bull runs are typically in higher range and cannot be compared to bear phases. OB1, OB2 together with the annualised daily returns and annualised standard deviation of returns for two bull runs, are presented below:
Table 1. The bulls (Jan 2019- Dec 2019) and (April 2020 – February 2021)

Source: author. Raw data source: Yahoo Finance.
Table 2. Global market crash (January 2020- March 2020)
Source: author. Raw data source: Yahoo Finance.
We see that for 2019, OB1 and OB2 were high for each of these equity indexes. However, that’s nothing compared to what we see now. From April 2020 to February 2021, four of these markets show crazily higher OB levels (as also returns and volatility). Only for the Dow Jones and the German Dax Index, OB levels have fallen slightly in 2020-21, but even then remain considerably high. Importantly, returns and volatility are higher after the outbreak of the pandemic in all of these markets.
While bull markets do demonstrate high OB levels, this is hardly ever sustainable. At the beginning of 2020, with the pandemic-led negative market shock, markets crashed (Table 2). Will 2021 be different? Assumedly, the markets believe prices going to such dizzying heights will continue ad infimum, which is why OB levels are sustainable. However, any negative shock (big or small) can start a selling spree. When the liquidation spree begins, as traders know only too well that markets are overbought, the crash is inevitable. This is why bubble bursts are unpredictable and lead to a huge erosion of value for shareholders. That might happen anytime, after two days or two years, depending on how long it is possible to find liquidity to justify the overbought levels. When that happens, sadly, the blind eye to overbought zones can lead to a heavy price to pay for many.
♣♣♣
Notes:
- The post gives the views of its authors, not the position of the National Institute of Bank Management, LSE Business Review or the London School of Economics.
- Featured image by Hans Eiskonen on Unsplash
- When you leave a comment, you’re agreeing to our Comment Policy


A well articulated analysis.My naive analysis is that the money(liquidity) in the hands of investors(financial markets) does not find adequate avenues for investment as real economy has slowed down due to Covid Pandemic.So it flows into stock market and pushes indices up.Technology facilitates such shift by enabling investors to participate in the market with the click of a mouse.The pullout will happen after real economy picks steam or something happens which sucks liquidity in a different sector.Till such time the markets are expected to be buoyant.