The 2021 World Happiness Report comes as the Covid-19 pandemic continues to claim lives and lay waste to livelihoods around the world. Richard Layard and Ekaterina Oparina introduce the WELLBY Approach and look at how wellbeing measures can be used to compare countries progress in improving social welfare and shape policies to increase wellbeing.
How can we compare countries in terms of social welfare? The well-being approach to these issues is simple. People want to live well, and they want to live long. Therefore, we should judge a society by the extent to which it enables people to live long lives, full of well-being.
For any individual, the measure of this is simply the well-being she experiences each year summed up over all the years that she lives, with a discount rate applied to account for increasing uncertainty the further we look into the future. And a natural name for the well-being experienced over one year is a Well-Being-Year (or WELLBY).
To look at how different countries are doing, we take the length of life into account as well as wellbeing.
Hence the measure of national social welfare today is average current well-being times the expectation of years of life. The “expectation of life” today is how long someone born now could expect to live if her chance of dying at each age was the same as that experienced this year by people of that age. This roots the calculations of life expectancy in data from the current year.
Does taking a length of life into account in this way change our rankings of countries compared to just looking at wellbeing as experienced now? And which countries have been doing the best in terms of the changes they have achieved in social welfare?
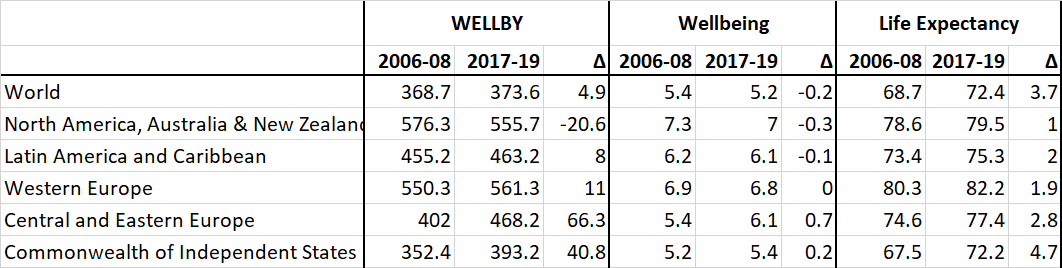
In table 1, we present the ranking of countries according to their level of WELLBYs per person in 2017-2019. Remarkably the top 11 countries in terms of WELLBYs are the same as the top 11 in Wellbeing. This is because life expectancy is so similar across the top 19 or so countries. At the very top is Finland, both in Well-being and in WELLBYs. Again, at the bottom, the lowest 11 countries in terms of WELLBYs include most of those which are also lowest in well-being. Overall, the correlation across countries between well-being and WELLBYs is 0.97 (while that between life expectancy and WELLBYs is 0.87).
Table 1. Ranking of countries according to their level of WELLBYs per person in 2017-2019
So adding in the length of life makes little difference to the ranking of countries by well-being, with which we are already familiar. But, adding in the length of life transforms our understanding of human progress over time.
Human progress since 2006
Since 2006-08, world well-being has been static, but life expectancy increased by nearly four years up to 2017-19 (we shall come to 2020 later). The rate of progress differed a lot across regions. The biggest improvements in life expectancy were in the former Soviet Union, in Asia, and (the greatest) in Sub-Saharan Africa. And these were the regions that had the biggest increases in WELLBYs.
In Asia, the exception is South Asia, where India has experienced a remarkable fall in well-being which more than outweighs its improved life expectancy. Life expectancy grew slowest in North America, which also had a substantial fall in well-being – hence an overall fall in WELLBYs. The other area where well-being fell was the Middle East/North Africa, and that area also experienced a fall in WELLBYs.
We find that by multiplying average wellbeing by life expectancy, the number of WELLBYs per person rose by 1.3% between 2006-08 and 2017-19 due to higher life expectancy, especially in less healthy countries. This was a huge reduction in the inequality of social welfare between countries. This is not because well-being has become more equal – it has not, due to the huge fall in well-being in India. But life expectancy has become much more equal, and the seven years increase in sub-Saharan Africa is truly remarkable.
Coming to 2020, life expectancy fell substantially. In the first year of COVID-19, two million people died of the disease – an increase of some 3.4% in deaths worldwide. But most of the deaths have been among older people, so the fall in life expectancy is much less than 3.4%. In the USA, which had a high death rate, one estimate is that life expectancy fell by one year in 2020. Similar estimates have been made for Britain, which has also had a high death rate. But, even if the fall in life expectancy in 2020 worldwide were as much as one year, this would not altogether undo the gain of 3.7 years over the preceding decade.
So, sticking with 2020, what can be said about the change in overall social welfare? It will have fallen if the proportional fall in life expectancy exceeded the proportional rise in average well-being. The World Happiness Report shows that estimated well-being fell in half the countries of the world and rose in the other half. But life expectancy probably fell in most countries. Not a good year.
Public policy
Policymakers have many levers: they can spend money, raise money, and make regulations. All these decisions should be based on their impact on WELLBYs. This means that spending policies should be ranked according to the total WELLBYs they produce per dollar of expenditure and authorised in that order until the available budget is exhausted.
As regards COVID-19 policy, as the World Happiness Report shows, the right strategy in 2020 was to suppress the virus. Countries that did this had fewer deaths and a better economy. There was no need to balance one against the other. However, in 2021 we shall increasingly have the vaccine. So, for countries that have failed to suppress the virus so far, the best course now may involve accepting some cases of illness (while the vaccine is being distributed) in order to protect the economy, children’s education, and the mental health of the population. For such a balancing act, the WELLBY approach is helpful.
The monetary value of a life year
In this balancing act, we have to take into account everything which affects WELLBYs. Besides much else, this includes the impact on WELLBYs of life-years lost and of changes in incomes. There is, thus, in any policy evaluation, an implicit measure of the amount of money that is of equivalent value to a year of life lost. For decades governments have been using estimates of this number to evaluate health interventions and safety improvements in road, rail, air transport, and workplaces.
These have been obtained using quite different methods from the WELLBY approach. Interestingly, the numbers they provide would not justify any of the lockdowns we have seen in Europe or the USA. And yet, the public approve of the lockdown.
Using the WELLBY approach we calculate that we should be willing to pay up to around $750,000 (widely spread) to save one life-year. It is a large number and higher than traditional values. Two comments are in order: first, traditional values would not justify most lockdowns, but the people support the lockdowns. Second, if public expenditure is constrained, it would not be right to fund all savings of a life-year that cost less than $750,000. But in this constrained situation, life-years should still be valued at that level relative to monetary outcomes.
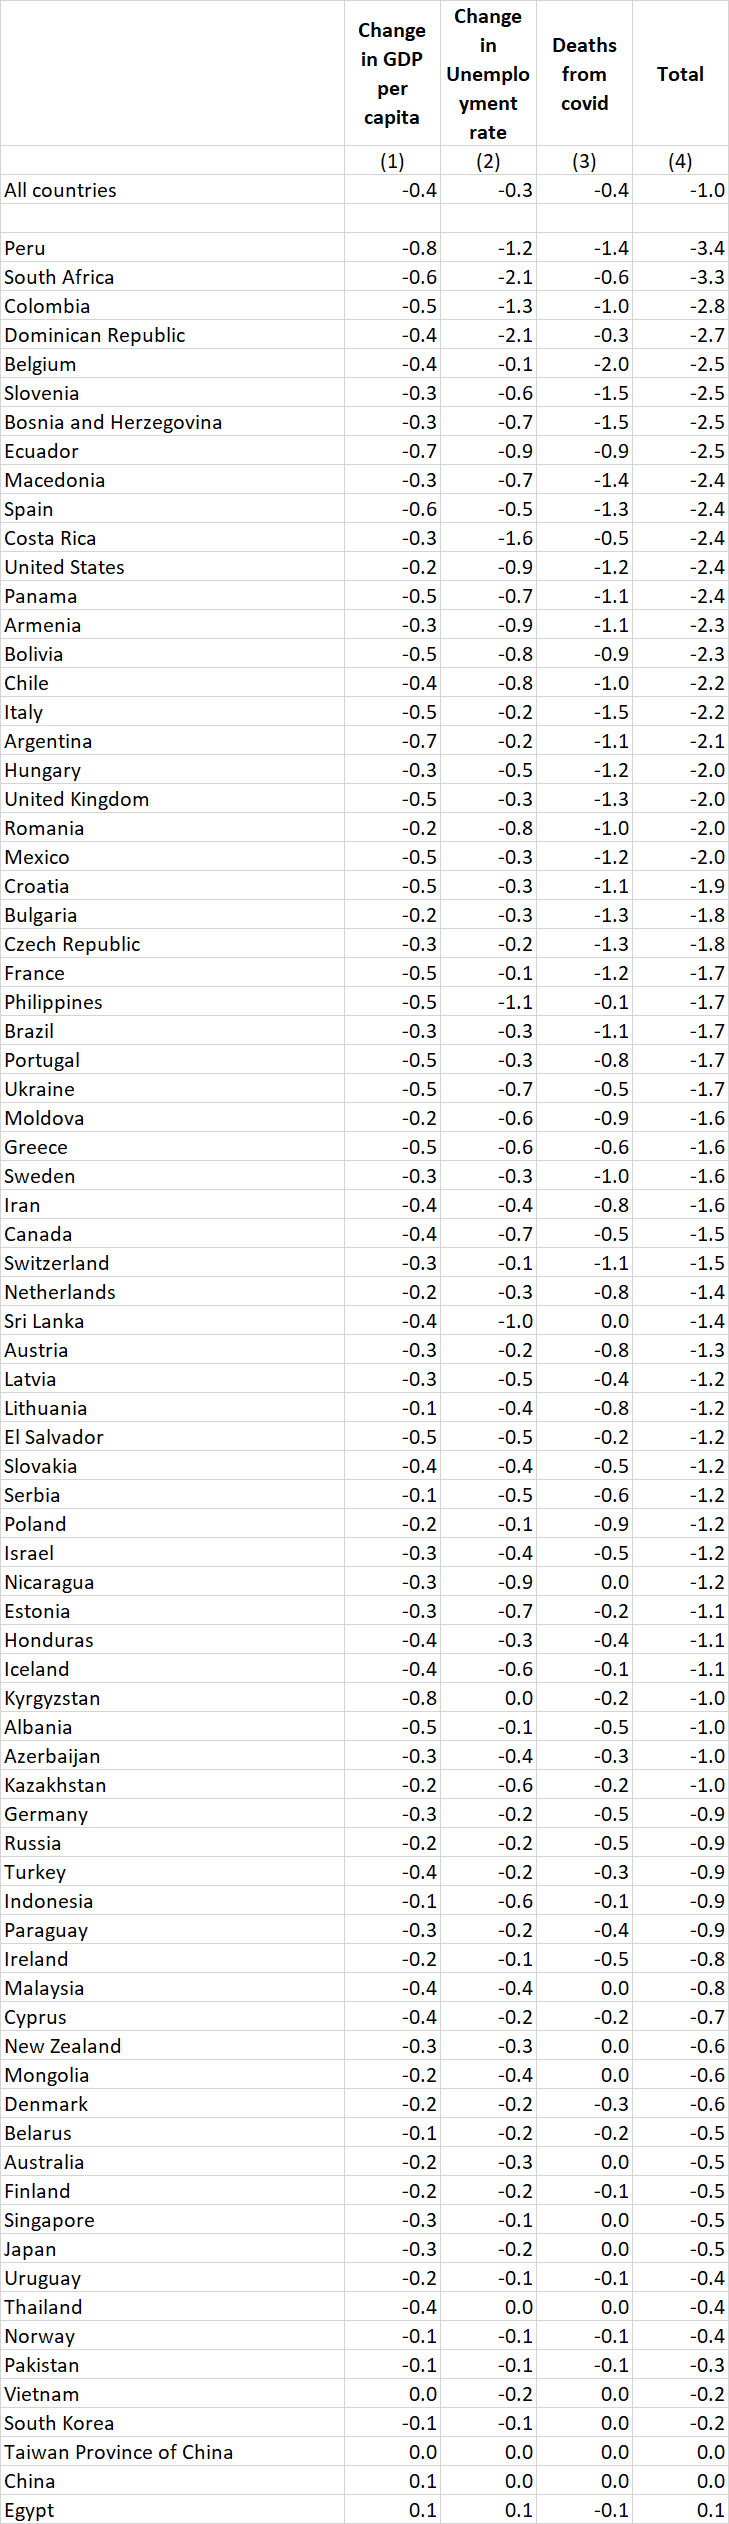
Finally, we can apply the WELLBY approach to estimating the combined impact of COVID on social welfare, taking into account only its effect on income per head, unemployment, and life expectancy. So unlike the rest of the chapter, we are not looking at estimates of the total change in well-being but only at estimated effects on well-being coming through GDP per head and unemployment.
Despite the approximate and provisional nature of the data, we have ranked countries according to how much they have suffered from these three factors combined, starting with those that suffered most.
Those who have suffered most include South Africa, the USA, and many Latin American countries. Most European countries come in the next group down. And in the least affected group come all the main parts of East and Southeast Asia (mainland China, Taiwan, Cambodia, Thailand, Vietnam, Singapore, and Japan). It is extremely interesting to look at the correlation of death rates and losses to GDP. Across 79 countries, the correlation is positive and quite substantial (r = 0.38). In other words, countries that controlled the virus also avoided the economic losses which affected other countries.
Table 2. World regions according to the combined impact of COVID on social welfare
Conclusions
The WELLBY approach offers the most plausible way of combining well-being with the length of life. It assumes that the value of life comes from the well-being it provides. And we do this because of our view that a good society delivers lives that are both long and satisfying.
This approach serves two purposes. First, it provides us with a more comprehensive way of assessing human progress and the performance of different countries. The story is basically positive. From 2006-08 to 2017-19 social welfare in the world rose from 369 to 374 WELLBYs per person. This was because, while well-being fell somewhat, life expectancy rose by 3.7 years. And WELLBYs became more evenly distributed across the world because life expectancy rose most in low-WELLBY regions.
However, in 2020 life expectancy fell in most countries, though not enough to wipe out at world level the gains since 2006-08. At the same time, the economy shrank, and unemployment increased. But typically, those countries which controlled the virus best also experienced the least hit to the economy – there was no trade-off between these two outcomes.
The second use of WELLBYs is to evaluate policy options. Well-being science now provides enough evidence for this to become more and more feasible. It should be used wherever possible to evaluate future strategies against COVID-19. And within 20 years, it will surely become the standard method of policy evaluation in more and more countries.
♣♣♣
Notes:
- You can read the World Happiness Report here.
- The post expresses the views of its authors, not the position of LSE Business Review or the London School of Economics.
- Featured image by Hai Tran on Unsplash
- When you leave a comment, you’re agreeing to our Comment Policy