The commuter hub was key to the spread of COVID-19 in London, write Christian Julliard, Ran Shi and Kathy Yuan (LSE). They estimate it contributed to over 42% of all London cases. When authorities are devising tiered local lockdowns, it pays to consider these network effects rather than looking only at cases in individual boroughs.
Another four-week national lockdown starts in England on 5 November, after which the government hopes to move areas back to Tier 1, 2 or 3, depending on their infection levels. Under the tiered system, the Department of Health and Social Care (DHSC) monitors and updates local authorities on their COVID alert levels (medium, high, or very high). Each of these three alert levels prescribes a set of lockdown rules. In adopting local lockdown measures, the government says it was ‘committed to ensuring the right levels of intervention in the right places to manage outbreaks.’
But what are the ‘right places’? Picking the right target requires correctly identifying local authorities with very high alert levels. These are determined by incidence, test positivity, hospital admissions, the reproduction (R) number (a statistic measuring how fast the virus is spreading), etc. These data are informative for disease surveillance and crucial for making inferences about disease outbreak risk.
What can go wrong?
Policymakers analyse the disease surveillance data using mathematical models to decide the alert levels of local authorities. An overly simplified example of this process could be grouping local authorities based on their most recent number of positive cases. However, even if the DHSC can collect the most accurate data and build the best models, their current local alert system can still misidentify lockdown targets. The reason is that this system tends to treat each local authority in isolation, thus ignoring the crucial network effects in the disease spread process.

Network effects capture the inter-location transmission: people catch COVID from others living outside their local areas. In a recent case study of London boroughs, we confirm the essential role of these network spillover effects. We found that residents in other boroughs spread the virus via the commuting network. The estimated magnitude of these network effects is large: it contributes to over 42% of all COVID-19 cases in London (see Figure 1). In comparison, local within-borough transmissions (“autoregressive” in Figure 1) account for less than 35%.
Figure 1. London COVID-19 confirmed cases and their origin
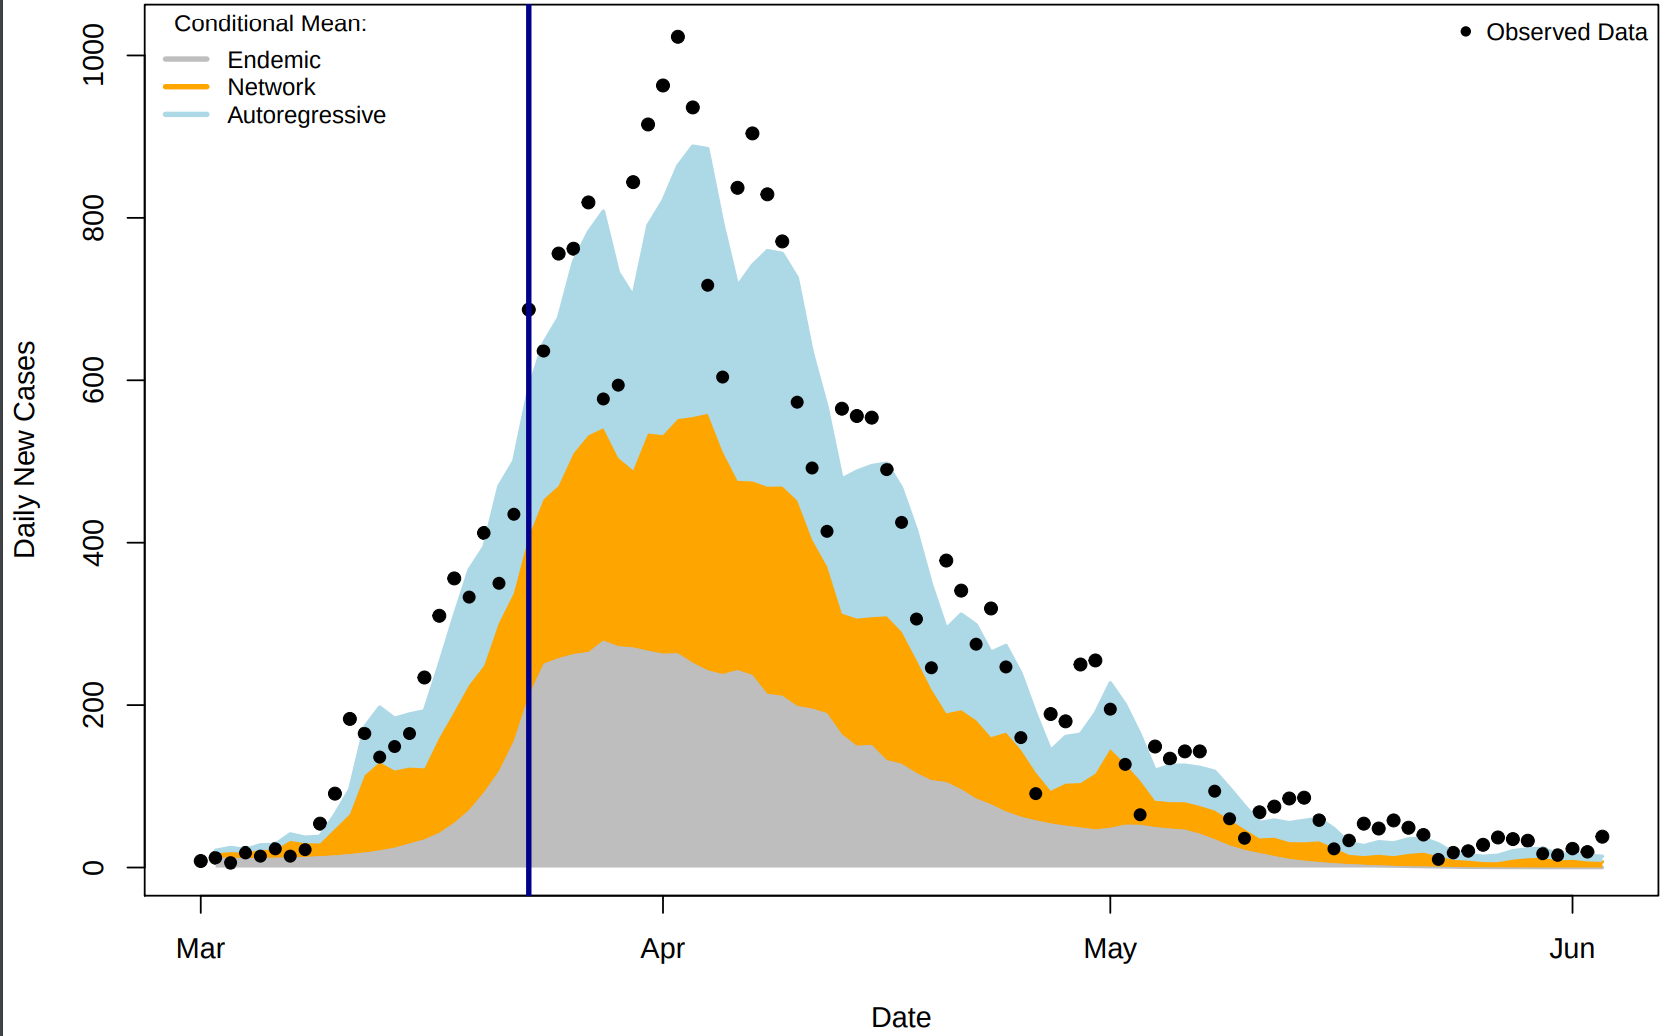
Figure 2. Effect of counterfactual lockdown dates on London COVID-19 spread
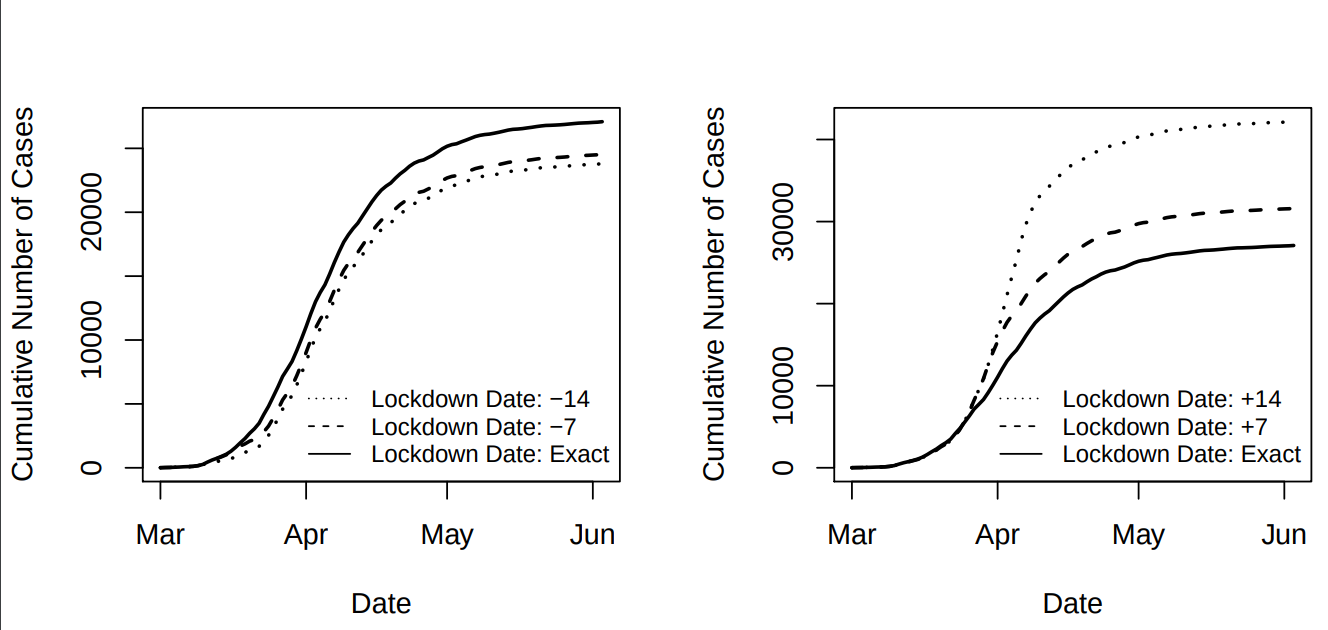
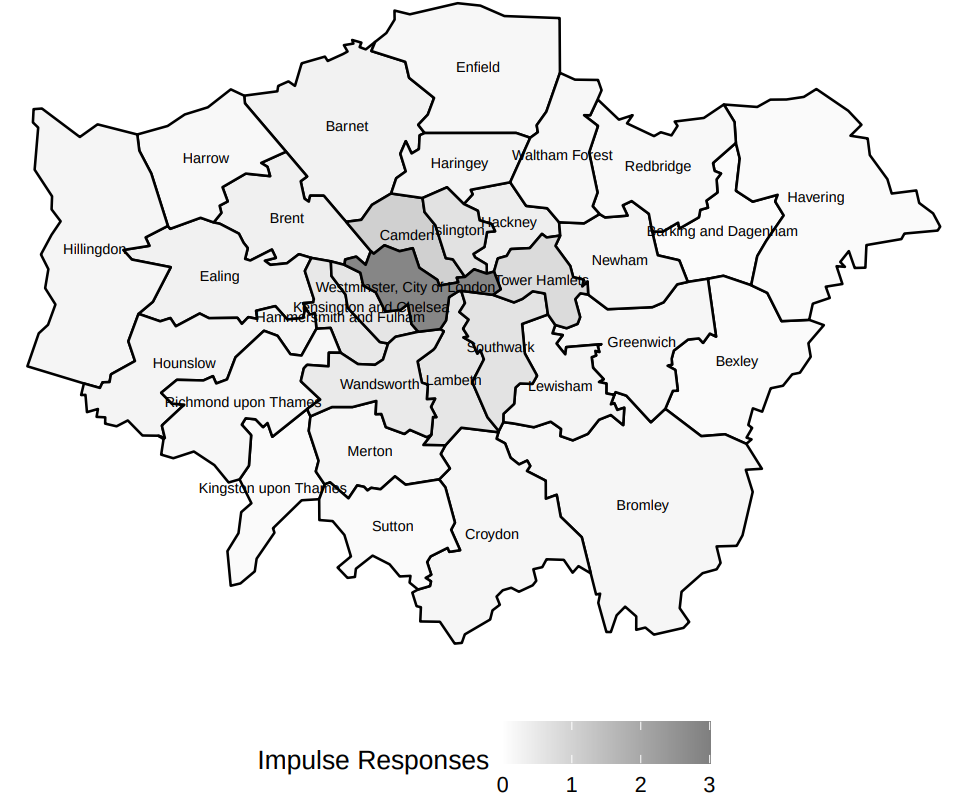
Lockdown policies work in reducing the COVID-19 transmission (see Figure 2) not only because they can control within-community spread but also because they stop transmission across separate locations. According to our estimation, the March 23 nationwide lockdown reduced the number of cases generated by local contact by around 75%. More importantly, the lockdown also decreased spillovers from workplaces to residential areas by about 12% and reduced home-to-work transmissions by as much as 80%. Both of these pathways represent first order network effects. When identifying lockdown targets, we should therefore incorporate this network view of the disease transmission dynamics. Under the local lockdown system, all local authorities should be treated equally, but some are more pivotal than others. These are the ones that sit at the centre of the disease transmission network. For instance, in London’s commuting network, the Westminster/City of London area is the key node. It dominates all other London boroughs in terms of network externalities generated. Before the March 23 lockdown, one additional case in this area is associated with three new cases in the whole greater London area in the following week (see Figure 3). In the meantime, Westminster/City of London area ranked (in descending order) only 26th out of 32 boroughs in terms of total local cases before the lockdown.
Figure 3. Number of new cases in Greater London generated within a week by one additional case in a given borough
The tiered alert system focuses primarily on severe outbreaks but ignores key players in the disease transmission network. Treating local authorities independently and ignoring the network effects could lead to suboptimal local lockdown plans.
Optimal lockdown policies should account for network effects
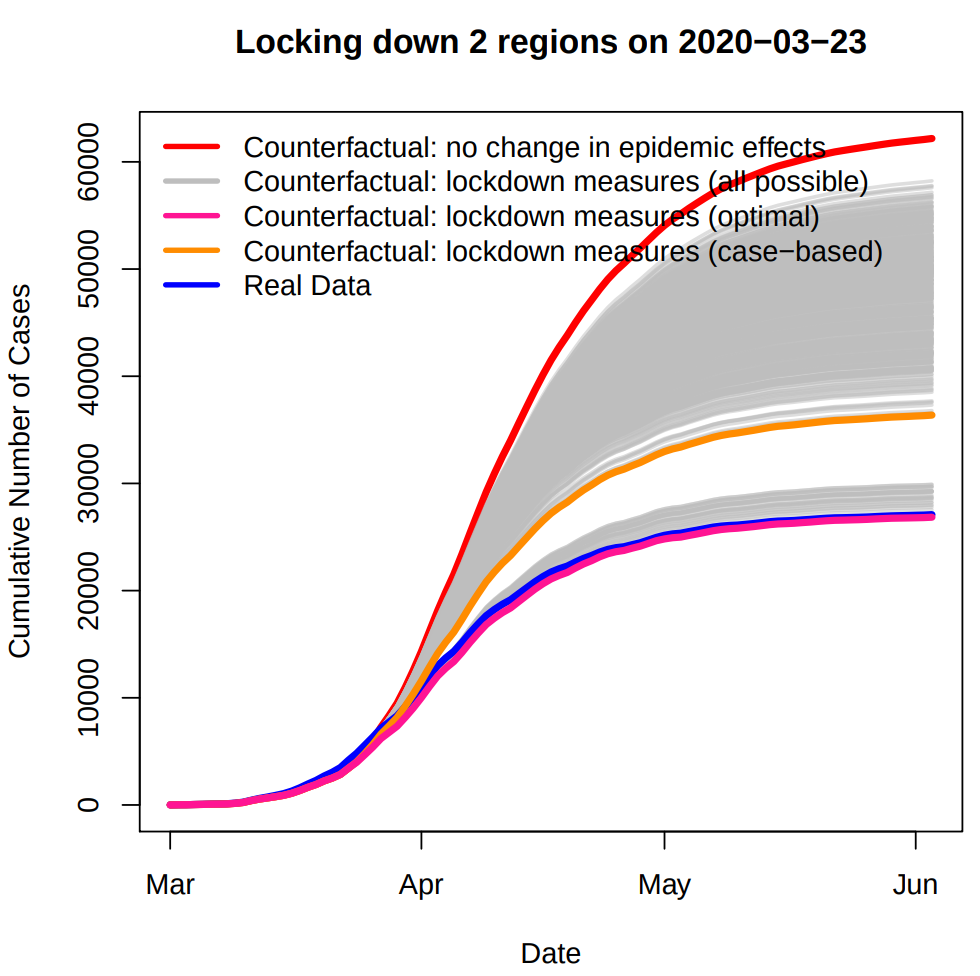
We simulate and compare alternative targeted lockdown schemes in London. When considering a lockdown limited to only one borough, we find that isolating Westminster/City of London – the borough with the largest network externality but very few local cases – minimises the total number of people expected to be infected. Similarly, when restricting the optimal lockdown to only two boroughs, we find that the optimal target areas are Westminster/City of London and Southwark (the borough with the highest number of cases). Therefore, optimal lockdown policies should be based on both the positive instances and network centrality in transmitting the disease. Furthermore, our simulations suggest that a lockdown of just these two boroughs would have achieved the same outcome, in terms of total infections in the Greater London area, as the actual national lockdown (see Figure 4).
Figure 4. Effect of counterfactual lockdown policies on London COVID-19 total cases
Our finding calls for special attention to the network effects when designing local lockdown policies. In our case study, the contact network is the commuting network in the Greater London area. In practice, important contact networks can take a number of forms, such as train or flight networks or any other traffic networks at the national or international level.
This post represents the views of the authors and not those of the COVID-19 blog, nor LSE.


This is an interesting and, to me, practical view of the situation. The virus is spread by people, so if you limit the movement of people you also limit the movement of the virus. Discouraging people from leaving their homes for non-essential reasons and instructing non-essential businesses to close is, and was, undermined by allowing public transport with a significant reach to continue to operate. A bit like trying to fill up a leaky bucket. I appreciate the situation is more nuanced than this simplistic view, e.g. not everyone can work from home and shutting the transport network would probably prevent many of the essential NHS staff from getting to work, which could have a catastrophic impact on the death toll and could be viewed as a desertion of responsibility by the policymakers.
However I think it is a reasonable expectation of civil society that policymakers are aware (either directly or via expert consultants) of such practical realities. So based on the actual response by policymakers, should we conclude that A) they simply overlooked the network effects for one reason or another (which raises serious questions about their competency), B) they were aware of but unconvinced by the network effects based on data available at the time of the decision-making, or C) they were aware of the network effects but consciously omitted them from the final decision in an attempt to somewhat mitigate the economic and or social impact of the pandemic?
In some other countries (France, for example), citizens could temporarily only leave their house if they had a special letter authorising them to do so. Surely the UK government could have issued such a letter to NHS and transport staff and anyone else who could prove that they could not work from home or had to attend an essential medical appointment via the transport network. So why didn’t they?