
 Russia experienced an extreme spike in death rates in the immediate aftermath of the break-up of the Soviet Union. Jay Bhattacharya, Christina Gathmann and Grant Miller write that while this has typically been explained using political and economic arguments, the real cause of Russia’s mortality crisis may have been the end of Mikhail Gorbachev’s anti-alcohol campaign. Using a series of statistical tests they illustrate that Russian death rates fell significantly during the campaign, with the hardest drinking regions experiencing a larger spike in death rates after the fall of the Soviet Union.
Following the demise of the Soviet Union, Russia experienced a 40 per cent surge in deaths between 1990 and 1994. As a consequence, life expectancy for men declined by 6.6 years from 64.2 to 57.6 years. The magnitude of this surge in deaths – coupled with the Soviet Union’s international prominence – has prompted observers to term this demographic catastrophe the “Russian Mortality Crisis.”
What caused this dramatic increase in mortality? Many people attribute the Russian mortality crisis to political and economic turmoil that followed the collapse of the Soviet Union, and to restructuring and reforms during the 1990s. We develop an alternative explanation for the observed pattern: the demise of the reputedly successful 1985-1988 Gorbachev Anti-Alcohol Campaign.
The Gorbachev Anti-Alcohol Campaign was unprecedented in scale and scope – and it operated through both supply and demand-side channels, simultaneously raising the effective price of drinking and subsidising substitutes for alcohol consumption. At the height of the campaign, official alcohol sales had fallen by as much as two-thirds (Russians responded by increasing home-production of alcohol called samogon – although our estimates suggest not by nearly enough to offset the reduction in state supply). In practice the campaign lasted beyond its official end – restarting state alcohol production required time, and elevated alcohol prices lingered.
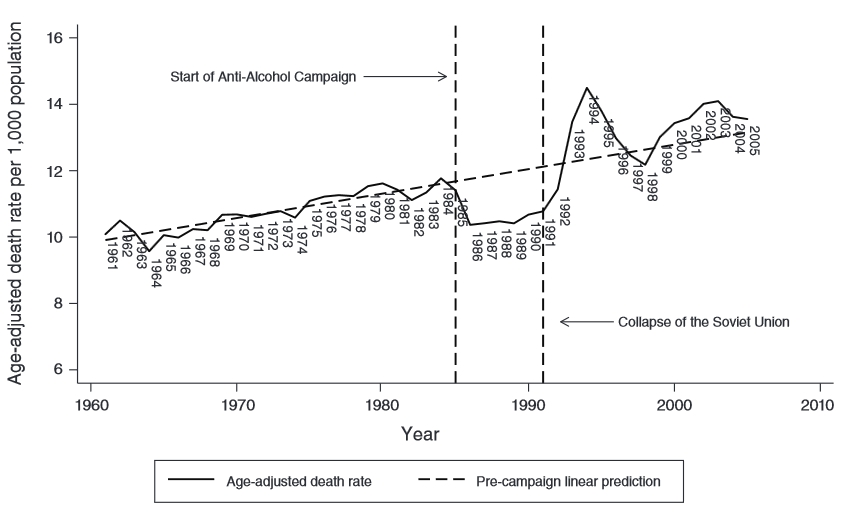
Figure 1 illustrates our basic logic. Age-adjusted Russian death rates had been increasing linearly between 1960 and 1984, plummeted abruptly with the start of the campaign in 1985, remained below the campaign trend throughout the latter 1980s, rose again rapidly during the early 1990s to a temporary peak in 1994, and then largely reverted back to Russia’s long-run trend.
Figure 1: Age-adjusted death rates in Russia (1960-2005)
Note: Data available from The Human Mortality Project. Pre-campaign linear trend estimated using ordinary least squares regression of mortality per 1,000 population on pre-campaign year.
The crisis could therefore be the combined result of lagged ‘catch-up’ mortality (as relatively weak marginal survivors saved by the campaign die at higher rates) together with reversion to the long-run trend. A lagged effect of alcohol consumption on mortality is consistent with findings in the medical literature on the delayed effects of alcoholism on both liver cirrhosis and heart disease.
We first establish the relationship between the Anti-Alcohol Campaign and Russian mortality during the latter 1980s. Because adequate sub-national data had not previously been compiled, we conducted extensive archival work to collect, digitise, and harmonise Russian statistical records not previously used by researchers to create a new panel data set of Russian oblasts spanning the years 1970-2000. We have made this data freely available here.
Because oblasts with higher rates of alcohol consumption prior to the campaign were disproportionately affected (experiencing relatively larger declines during campaign years), we flexibly analyse oblast-level changes in mortality over time that vary in proportion to this summary measure of campaign intensity. Remarkably, we find that the campaign is associated with about 400,000 fewer deaths per year, a reduction of 24 per cent relative to the pre-campaign crude death rate.
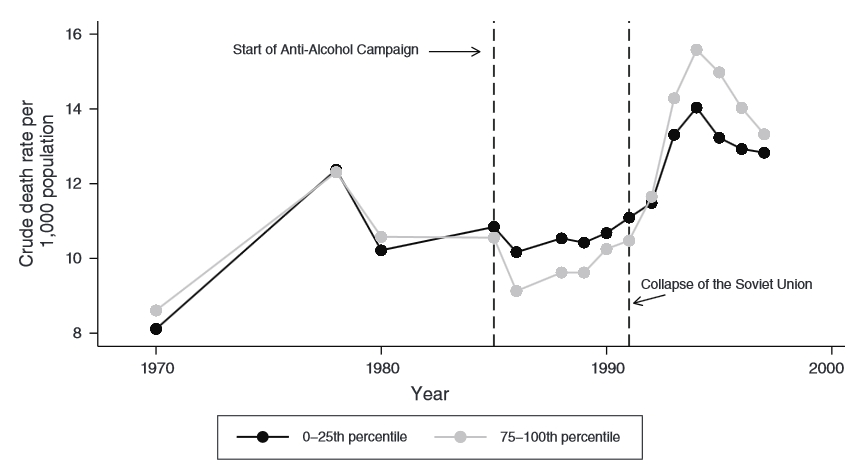
Our approach then also reveals, in a flexible way, the lagged effects of the campaign and its end on Russian mortality throughout the 1990s. Consistent with the aggregate relationship shown in Figure 1, we find that harder-drinking oblasts prior to the campaign not only experienced larger reductions in mortality during the late 1980s, but also experienced disproportionate increases in deaths during the 1990s, peaking in the middle of the decade. Causes of death more closely related to alcohol consumption (circulatory disease, accidents and violence, and alcohol poisoning) also increased relatively more in these oblasts during the 1990s. Figure 2 shows these differential changes in mortality throughout the 1980s and 1990s for oblasts in the top and bottom quartiles of the pre-campaign distribution of alcohol consumption (i.e. the hardest-drinking and most temperate oblasts).
Figure 2: Crude death rates by pre-campaign alcohol consumption (1970-2000)
Note: The lighter line shows the death rates for oblasts (regions) in the top 25 per cent for total alcohol consumption prior to the campaign. The darker line shows death rates for those in the bottom 25 per cent for alcohol consumption prior to the campaign.
Overall, our estimates explain a large share of the Russian mortality crisis. Given the volume of claims that Russia’s political and economic transition is responsible for the mortality crisis, we carefully test the robustness of our findings to the inclusion of controls for local economic conditions (GDP per capita, the employment rate, and employment in private manufacturing – a measure of privatisation) during the transition period. Strikingly, we find that our results are resilient to – and in some cases are strengthened by – controlling for these local economic factors.
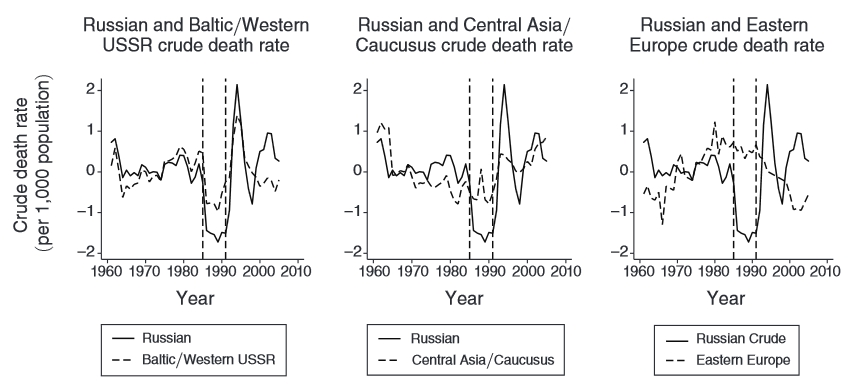
Finally, we document cross-country patterns of mortality throughout the 1980s and 1990s that are commensurate with campaign exposure in other former Soviet States and Eastern European countries. Figure 3 compares de-trended crude death rates in former Soviet and other Eastern European states with those from Russia between 1960 and 2005. Former Soviet states in the West and in the Baltics exhibit mortality declines similar to Russia during the late 1980s, and these are followed by similar surges during the early 1990s. This pattern is also present – but attenuated – in former Soviet states with large Muslim populations for whom alcohol policy matters less (in the Caucuses and Central Asia). By contrast, mortality patterns in Eastern European countries undergoing political and economic transitions, but not subjected to the campaign (the Czech Republic, Hungary, Poland, and the Slovak Republic) are starkly different.
Figure 3: Crude death rates in former-Soviet and non-Soviet states (1960-2005)
Note: The figure in the Y-axis refers to the de-trended crude death rate (i.e. a figure below 0 shows that death rates were below the predicted trend, while a figure above 0 indicates that they were higher).
Although there are important challenges and limitations in conducting research on Russia’s mortality crisis, the variety of rigorous analyses that we report in our longer paper strongly suggest that the end of the Gorbachev Anti-Alcohol campaign played a central role in the Russian Mortality Crisis – and that Russia’s transition to capitalism and democracy per se was not as lethal as many suggested.
For a longer discussion of this topic see the authors’ paper in American Economic Journal: Applied Economics
Please read our comments policy before commenting.
Note: This article gives the views of the authors, and not the position of EUROPP – European Politics and Policy, nor of the London School of Economics.
Shortened URL for this post: http://bit.ly/1c13API
_________________________________
 Jay Bhattacharya – Stanford University
Jay Bhattacharya is an Associate Professor of Medicine and a CHP/PCOR core faculty member. His research focuses on the constraints that vulnerable populations face in making decisions that affect their health status, as well as the effects of government policies and programs designed to benefit vulnerable populations.
 Christina Gathmann – University of Heidelberg
Christina Gathmann is Professor of Economics at the University of Heidelberg. Her research interests include public economics, labour economics, policy evaluation, migration, and political economy.
–
 Grant Miller – Stanford University
Grant Miller is an Associate Professor of Medicine at the Stanford University School of Medicine, a Core Faculty Member at the Center for Health Policy/Primary Care and Outcomes Research, a Senior Fellow at the Freeman Spogli Institute for International Studies, and a Research Associate at the National Bureau of Economic Research (NBER). His primary interests are health and development economics and economic demography.


