 Party membership is often cited as being uniformly in decline across European democracies. Based on results from a study of 47 parties in six European countries between 1960 and 2010, Ann-Kristin Kölln writes that while this is true for some parties, it is by no means true for all. She notes that almost a quarter of the parties contained in her study did not lose members over the observed period, with newer parties more likely to experience membership growth than older, more consolidated parties.
Almost all political parties in modern democracies take pride in a large membership size. Members are desirable for financial, organisational, programmatic, and legitimacy reasons. And yet, research shows that party membership has been declining across European democracies throughout the past decades. For example, a recent House of Commons research paper states that less than 1 per cent of the British electorate is enrolled in a political party today; in 1983, it was still 3.8 per cent.
Are some types of parties more exposed to membership decline than others?
Survey researchers employing micro-level theories have made great headway in explaining the increasing unwillingness of citizens to enrol in parties. An entirely new party-level dataset has also now enabled the testing of party-level explanations for party membership decline.
Membership decline is not uniform across parties. The officially reported annual data of 47 parties in Denmark, Germany, The Netherlands, Norway, Sweden, and the United Kingdom between 1960 and 2010 show what country-level studies could not: a substantial number of parties have not in fact been losing members in recent decades. Around 23 per cent of the analysed parties show either patterns of growth or stability over time. Figure 1 illustrates the development in membership ratios (membership size / size of the electorate) of some of Europe’s ‘success stories’. Membership size measured on the party-level reveals substantial variation that aggregate country-level data conceal.
Figure 1: Party-level membership/electorate ratios for selected parties in European countries
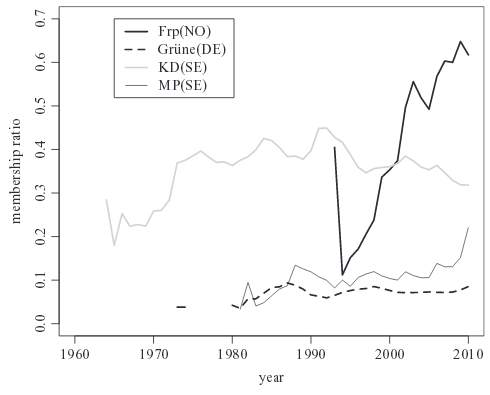
Note: Abbreviations are FrP: Progress Party; Grüne: Alliance ‘90/The Greens; KD: Christian Democrats; MP: Green Party; NO: Norway; DE: Germany; SE: Sweden.
Two party-level approaches exist that propose explanations for the variation in membership development. The life-cycle approach explains membership size by a party’s different life-phases or levels of institutionalisations, whereas the modernisation approach suggests a pattern of development according to the ideological family a party belongs to.
The main idea behind the life-cycle approach is that a party is facing new opportunities, challenges and incentives at every stage of its existence. The necessity or desirability of party membership changes throughout a party’s life cycle. For example, at the beginning of a party’s life cycle, visibility and initial electoral support are crucial for party survival. A large and loyal membership base can assist in that. Accordingly, a party will exert greater efforts to increase its membership size at an early stage of the life cycle. During later stages when the party is already established, members are less important and the parties’ efforts in attracting them subside. Therefore, the life-cycle approach predicts that membership size should increase during an early stage of institutionalisation, with fewer members enrolling as the party institutionalises.
The modernisation approach is complementary to this. It suggests that parties of certain party families should be more exposed to membership decline than others. In general, modernisation theories propose a shift in citizens’ prioritised values from materialist to post-materialist values. Citizens connect less to parties that do not capture the new political values, while new parties representing post-materialist values, such as ecological parties, should be on the rise. Additionally, the successful implementation of welfare states and the decline of religiosity over the last century should lessen the appeal of social-democratic and Christian parties. Parties belonging to those families should be more heavily impacted by membership decline.
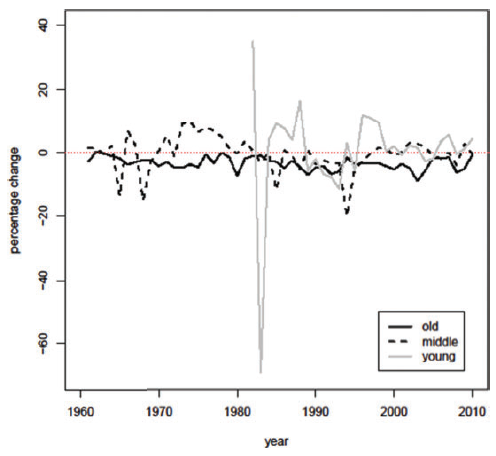
The results of multilevel modelling and time-series analyses show some support for both theories. Figure 2 illustrates the development of membership ratios for three different age groups of parties: those that were founded before the end of World War II (labelled ‘old’), those that were founded after World War II (labelled ‘middle’) and those that were founded after 1980 (labelled ‘young’). The y-axis displays values of percentage changes, i.e. the percentage change in the membership ratio in one year compared to the previous year.
The graph supports the life-cycle approach, as ‘old’ parties have a continuously negative growth rate. This means that parties founded before 1945 continuously lost members between 1960 and 2010. Middle-aged parties, on the other hand, have undergone a more mixed development, which sometimes also included consecutive periods of growth in membership ratios, for instance during the 1970s. Finally, the group of ‘young’ parties shows the strongest fluctuations in the beginning of their recording but with a number of straight gains in the late 1980s and mid-1990s.
Calculating average growth rates per age group validates these findings. Old parties yield a growth rate of -3.46 (standard deviation = 2.03), middle-aged parties yield -0.42 (standard deviation = 5.70) and young parties yield 0.60 (standard deviation = 16.04). Therefore, parties founded before 1945 have annually lost, on average, 3.46 per cent of their membership ratio over the period 1960-2010. The difference between the groups of old and middle-aged parties is also statistically significant.
Figure 2: Parties’ percentage changes per age group
Note: For more information, see the author’s recent paper in Party Politics.
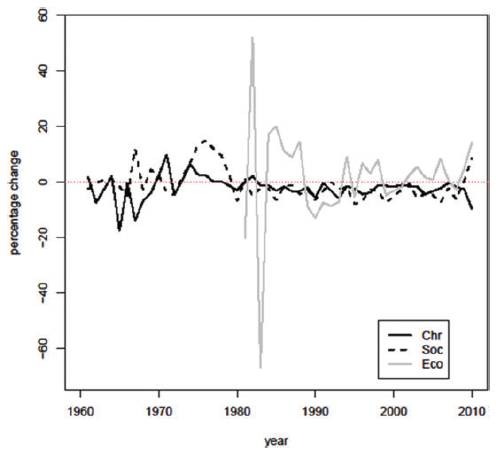
The modernisation approach also finds support in the data, yet to a smaller degree, as Figure 3 illustrates. It shows again the percentage change in membership ratios over time for three party families (Chr: Christian; Soc: social-democratic; Eco: ecological). Parties belonging to the ecological party family experienced considerable fluctuation, especially in the earlier years. Nonetheless, it is the only party family which has mostly experienced positive percentage changes since the mid-1990s. In comparison, the social democratic party family has been recording only negative percentage changes since the early 1980s. Only the very last change between 2009 and 2010 is positive, due to the British Labour Party’s gains in membership of around 0.08 percentage points in membership ratios.
Likewise, Figure 3 shows that Christian parties have continuously experienced negative percentage changes since the 1980s. All three patterns provide support for the modernisation approach, which is further validated by the party families’ growth rates. Christian and social-democratic parties have annually lost, on average, 2.15 per cent and 1.68 per cent of their membership ratio, respectively. Green parties gained, on average, 1.3 per cent every year. However, the differences in growth rates are not statistically significant so the results only provide suggestive evidence for the modernisation approach.
Figure 3: Parties’ percentage changes per party-family belonging
Note: For more information, see the author’s recent paper in Party Politics.
On the basis of these results, party membership decline can no longer be considered the norm across European democracies. Almost 23 per cent of the analysed parties from six European countries do not show signs of decline. However, the findings also show that membership decline follows a pattern. The more consolidated parties are, the fewer members they hold.
This also makes sense because more established parties require fewer grassroots members to spread the message, compared to new parties without an established network. As a party consolidates it faces different opportunities and challenges and it becomes less dependent on a large membership size. And while some party families appear to be more heavily affected by membership decline than others, few clear-cut patterns were detected. At the same time, it is noteworthy that the ecological party family stands out as the only group of parties that is growing in membership size.
Please read our comments policy before commenting.
Note: This article originally appeared at our partner site, Democratic Audit, and summarises findings from the author’s recent paper in Party Politics. The article gives the views of the author, not the position of EUROPP – European Politics and Policy, nor of the London School of Economics. Featured image credit: © European Union 2014 – European Parliament (CC-BY-SA-ND-NC-3.0)
Shortened URL for this post: http://bit.ly/1N6MxQ7
_________________________________
Ann-Kristin Kölln – University of Gothenburg
Ann-Kristin Kölln is COFAS Marie Curie Fellow and Postdoctoral researcher at the Department of Political Science at the University of Gothenburg. She is also Fellow at d|part, a think tank for political participation.