How can we compare the impact of Covid-19 on different countries across the world? Tim Vlandas proposes a pandemic ‘misery index’ that incorporates data covering both the health and economic dimensions.
What has been the economic and health performance of different countries since the Covid-19 crisis began? I propose to rank countries on the basis of how they have fared since the ongoing pandemic began by combining data on two dimensions: a health dimension capturing mortality data; and an economic dimension capturing increases in unemployment.
While the two indicators I select cannot provide an exhaustive picture, they are nevertheless useful in giving us some sense of how countries have fared across two of the dimensions that the Covid-19 crisis has affected most.
A measure of health costs
The health dimension is based on the so-called p-score. This data is available from the ourworldindata website (data extracted on 14 November 2020) and captures the weekly deviation of current mortality to 5 years average for that week.
Excess mortality figures have three advantages over more direct measures of Covid-19 deaths. First, they are not influenced by differences in definitions of what it means to have died from Covid-19. Second, they do not depend on the testing capacity of the country under consideration. Third, they include the total ‘health cost’ of the pandemic in terms of mortality, i.e. the excess deaths that are the product of both the pandemic and the policy responses to the pandemic.
A measure of economic costs
However, as is well recognised and widely discussed, the pandemic and our policy responses entail significant economic costs. Many economic indicators could be relevant for capturing the economic costs. For my purpose, I focus on monthly unemployment rate data, which is extracted from the OECD website.
Partly, this choice is based on data availability constraints, since the alternative of using GDP growth data would be hindered by more limited, less recent and less frequent data at the time of writing. But partly this choice finds inspiration in the so-called ‘misery index’ which was created following the stagflation of the 1970s. At the time, governments were facing – and attempting to address more or less successfully – both high inflation and high unemployment.
Adverse unemployment performance can be captured in two distinct ways. The first is simply to look at the average monthly unemployment rate. However, this does not account for the fact that when the pandemic hit, countries started from different relative positions. Since the p-score is calculated as a percentage increase from a previous average, I calculate an ‘unemployment score’ as the percentage increase in unemployment from one month to the next.
Country coverage
The following countries are included in my analysis: Austria, Belgium, Canada, Chile, Czech Republic, Denmark, England and Wales, Estonia, Finland, France, Germany, Greece, Hungary, Iceland, Israel, Italy, Latvia, Lithuania, Luxembourg, Netherlands, Norway, Poland, Portugal, Slovakia, Slovenia, South Korea, Spain, Sweden, and the United States. Because ourworldindata does not report excess deaths by age groups for the UK as a whole but instead for England and Wales, this is the data I use throughout. For most countries. I have data from January to September 2020 (inclusive).
Excess mortality by age group
I first plot the weekly evolution of excess mortality for four distinct age groups (figure 1): 15-64; 65-74; 75-84 and 85+. The figure reveals the (by now) familiar worse performers, most notably Belgium and England. It is worth noting that the English experience is not atypical in the UK given the similar picture for Scotland and to a lesser extent Northern Ireland.
Figure 1: Weekly excess mortality by age group
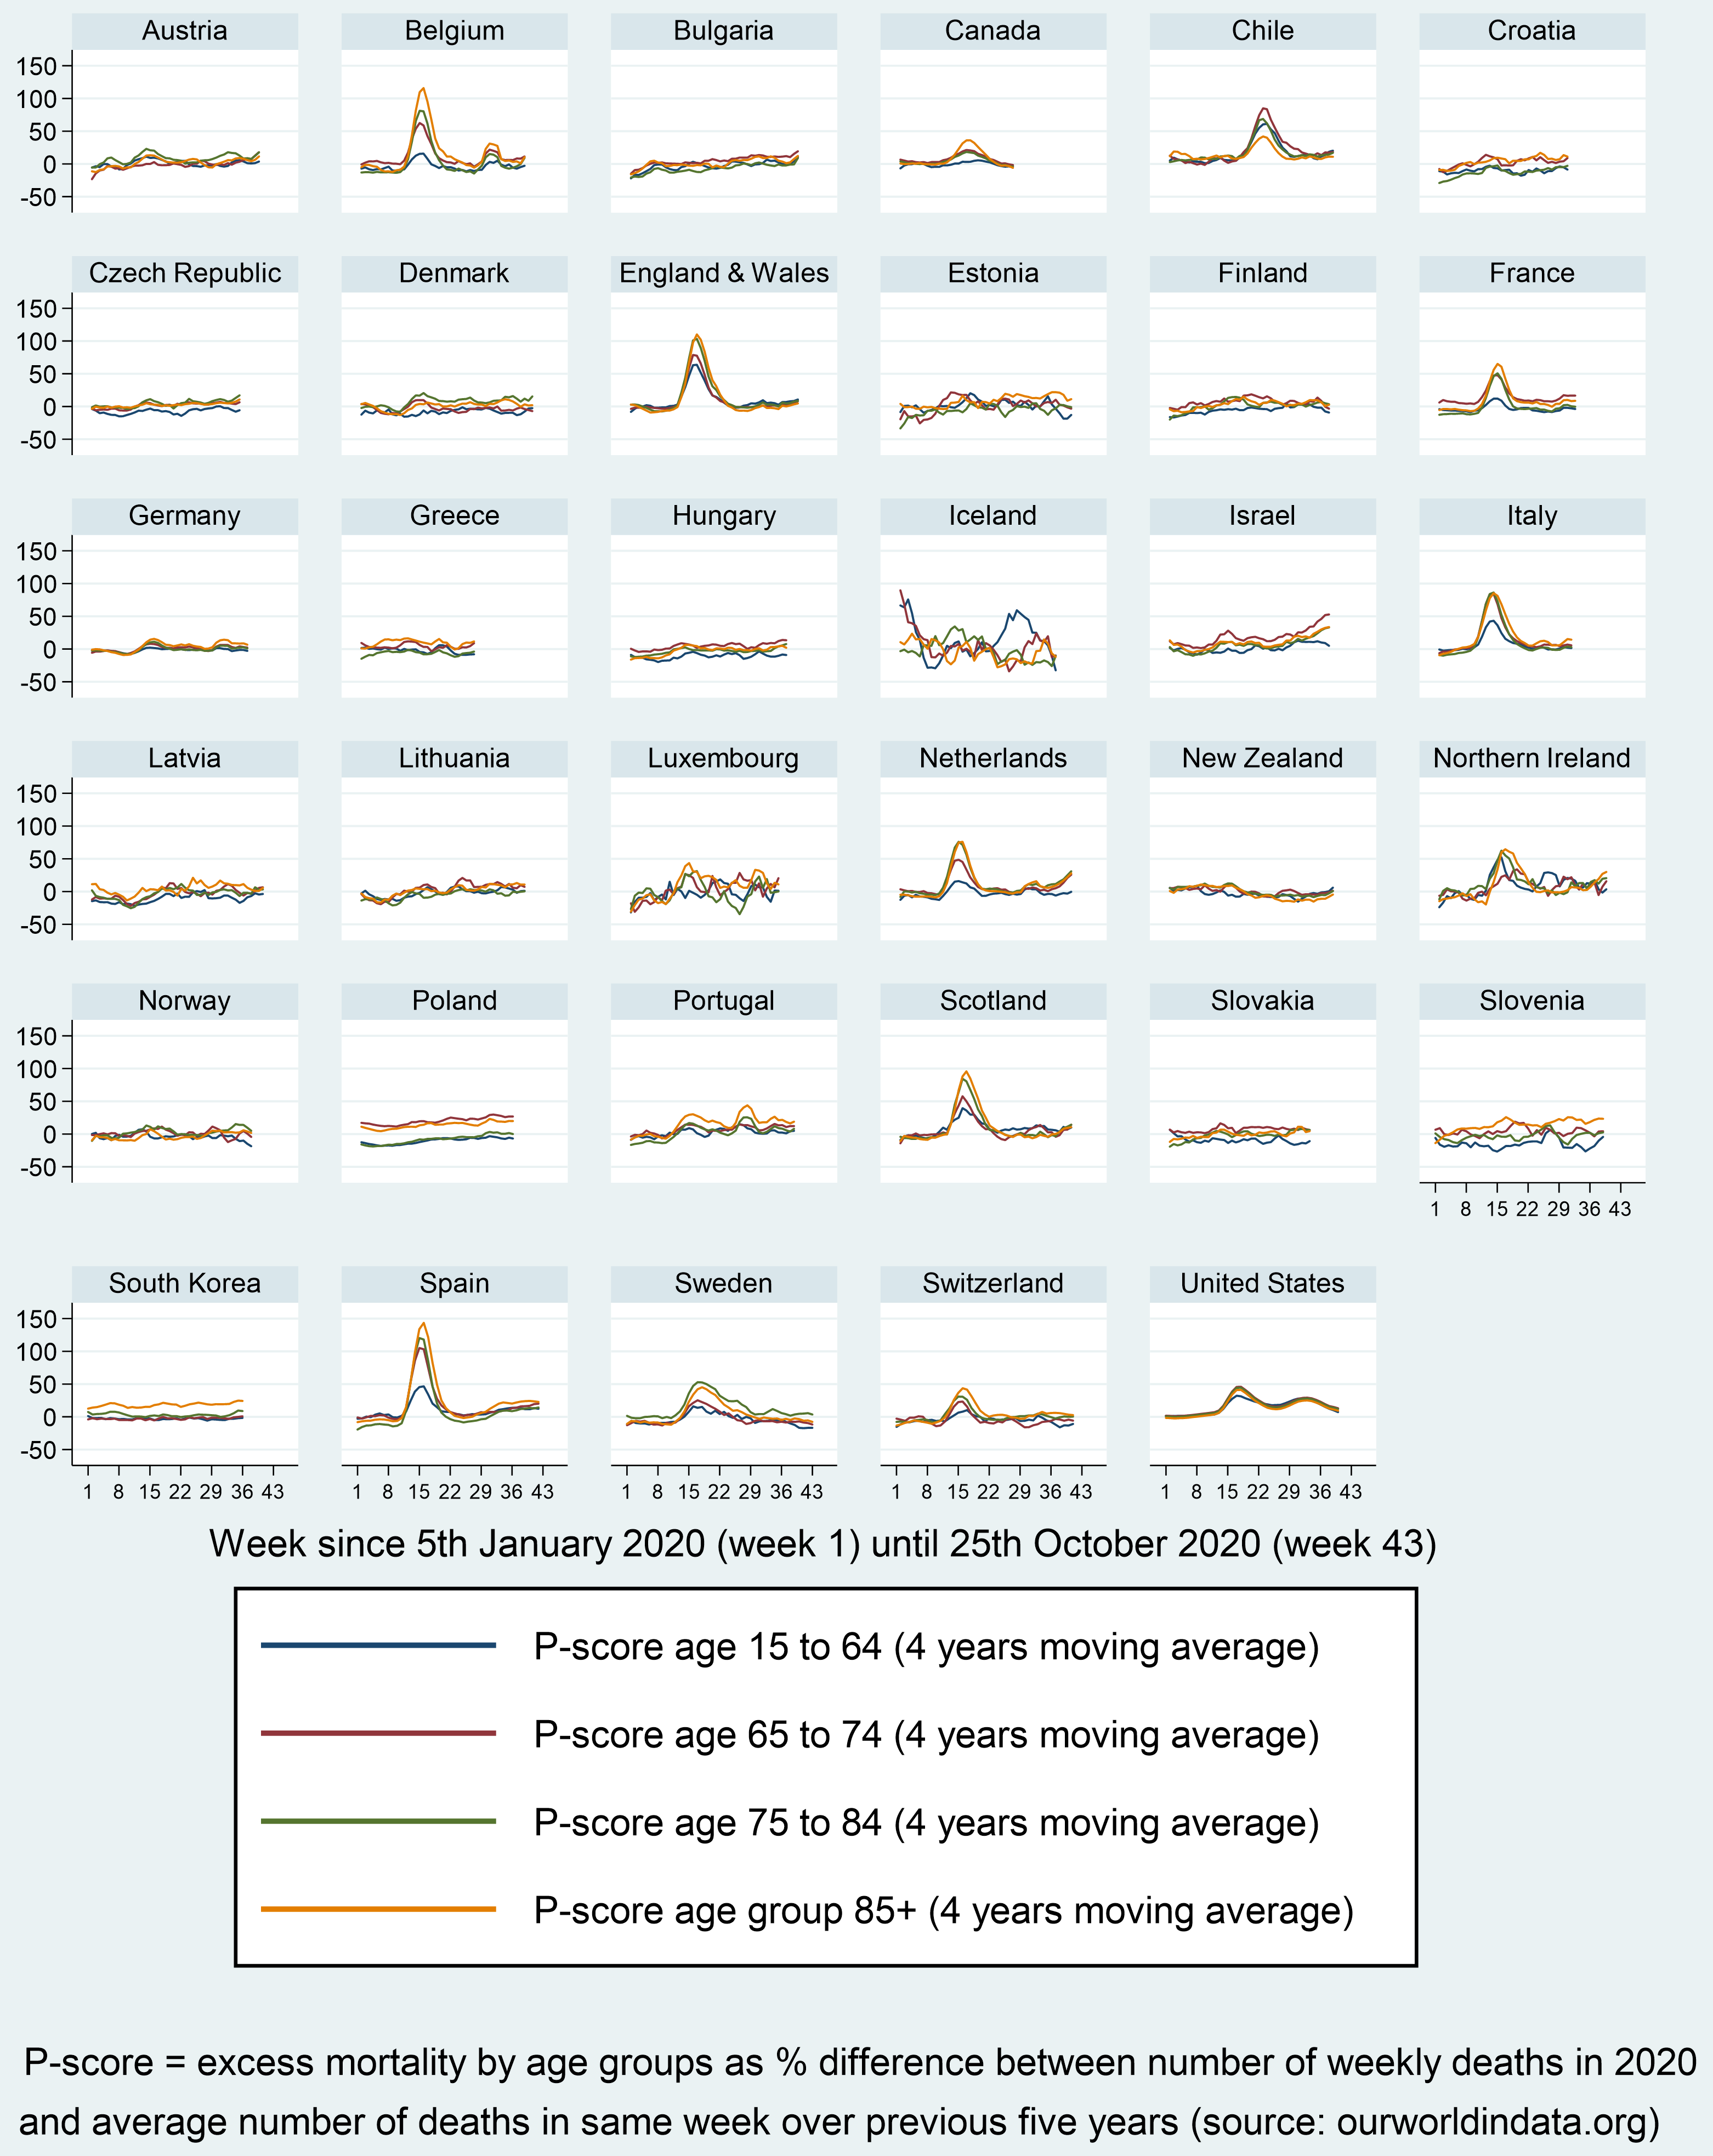
Other countries that did not fare well include Chile, Spain, Netherlands, and Italy; although we can observe differences in the timing of the peak. In all cases, excess mortality is a strong function of age, as has been well documented elsewhere.
Economic and health costs over time
If we abstract from the cross-national variation, we can see February was actually below the excess mortality average of the last five years for that time of the year and in March the average for our countries only experienced a mild increase. By contrast, in April countries experienced very significant rises in their excess mortality (Figure 2).
Figure 2: Monthly excess mortality and unemployment score

Bringing in the labour market deterioration into the picture, the increase in unemployment associated with the lockdown measures many countries introduced is also apparent. From May onwards and well into September, both unemployment and mortality stopped increasing in any substantial way across this sample of countries.
The correlation between the unemployment score and measures of excess mortality for different age groups is statistically significant and positive but modest (between 0.13 and 0.15), which suggests that countries’ performance in one dimension does not relate strongly for its performance on the other dimension. This contrasts with claims about the automatic and inevitable adverse effects of addressing the pandemic for the economy, but also contradicts claims about the presumed positive effects of addressing the pandemic for the economy (at least in the short term).
Figure 3: Excess mortality by country and age group over whole period (from February 2020 onwards)
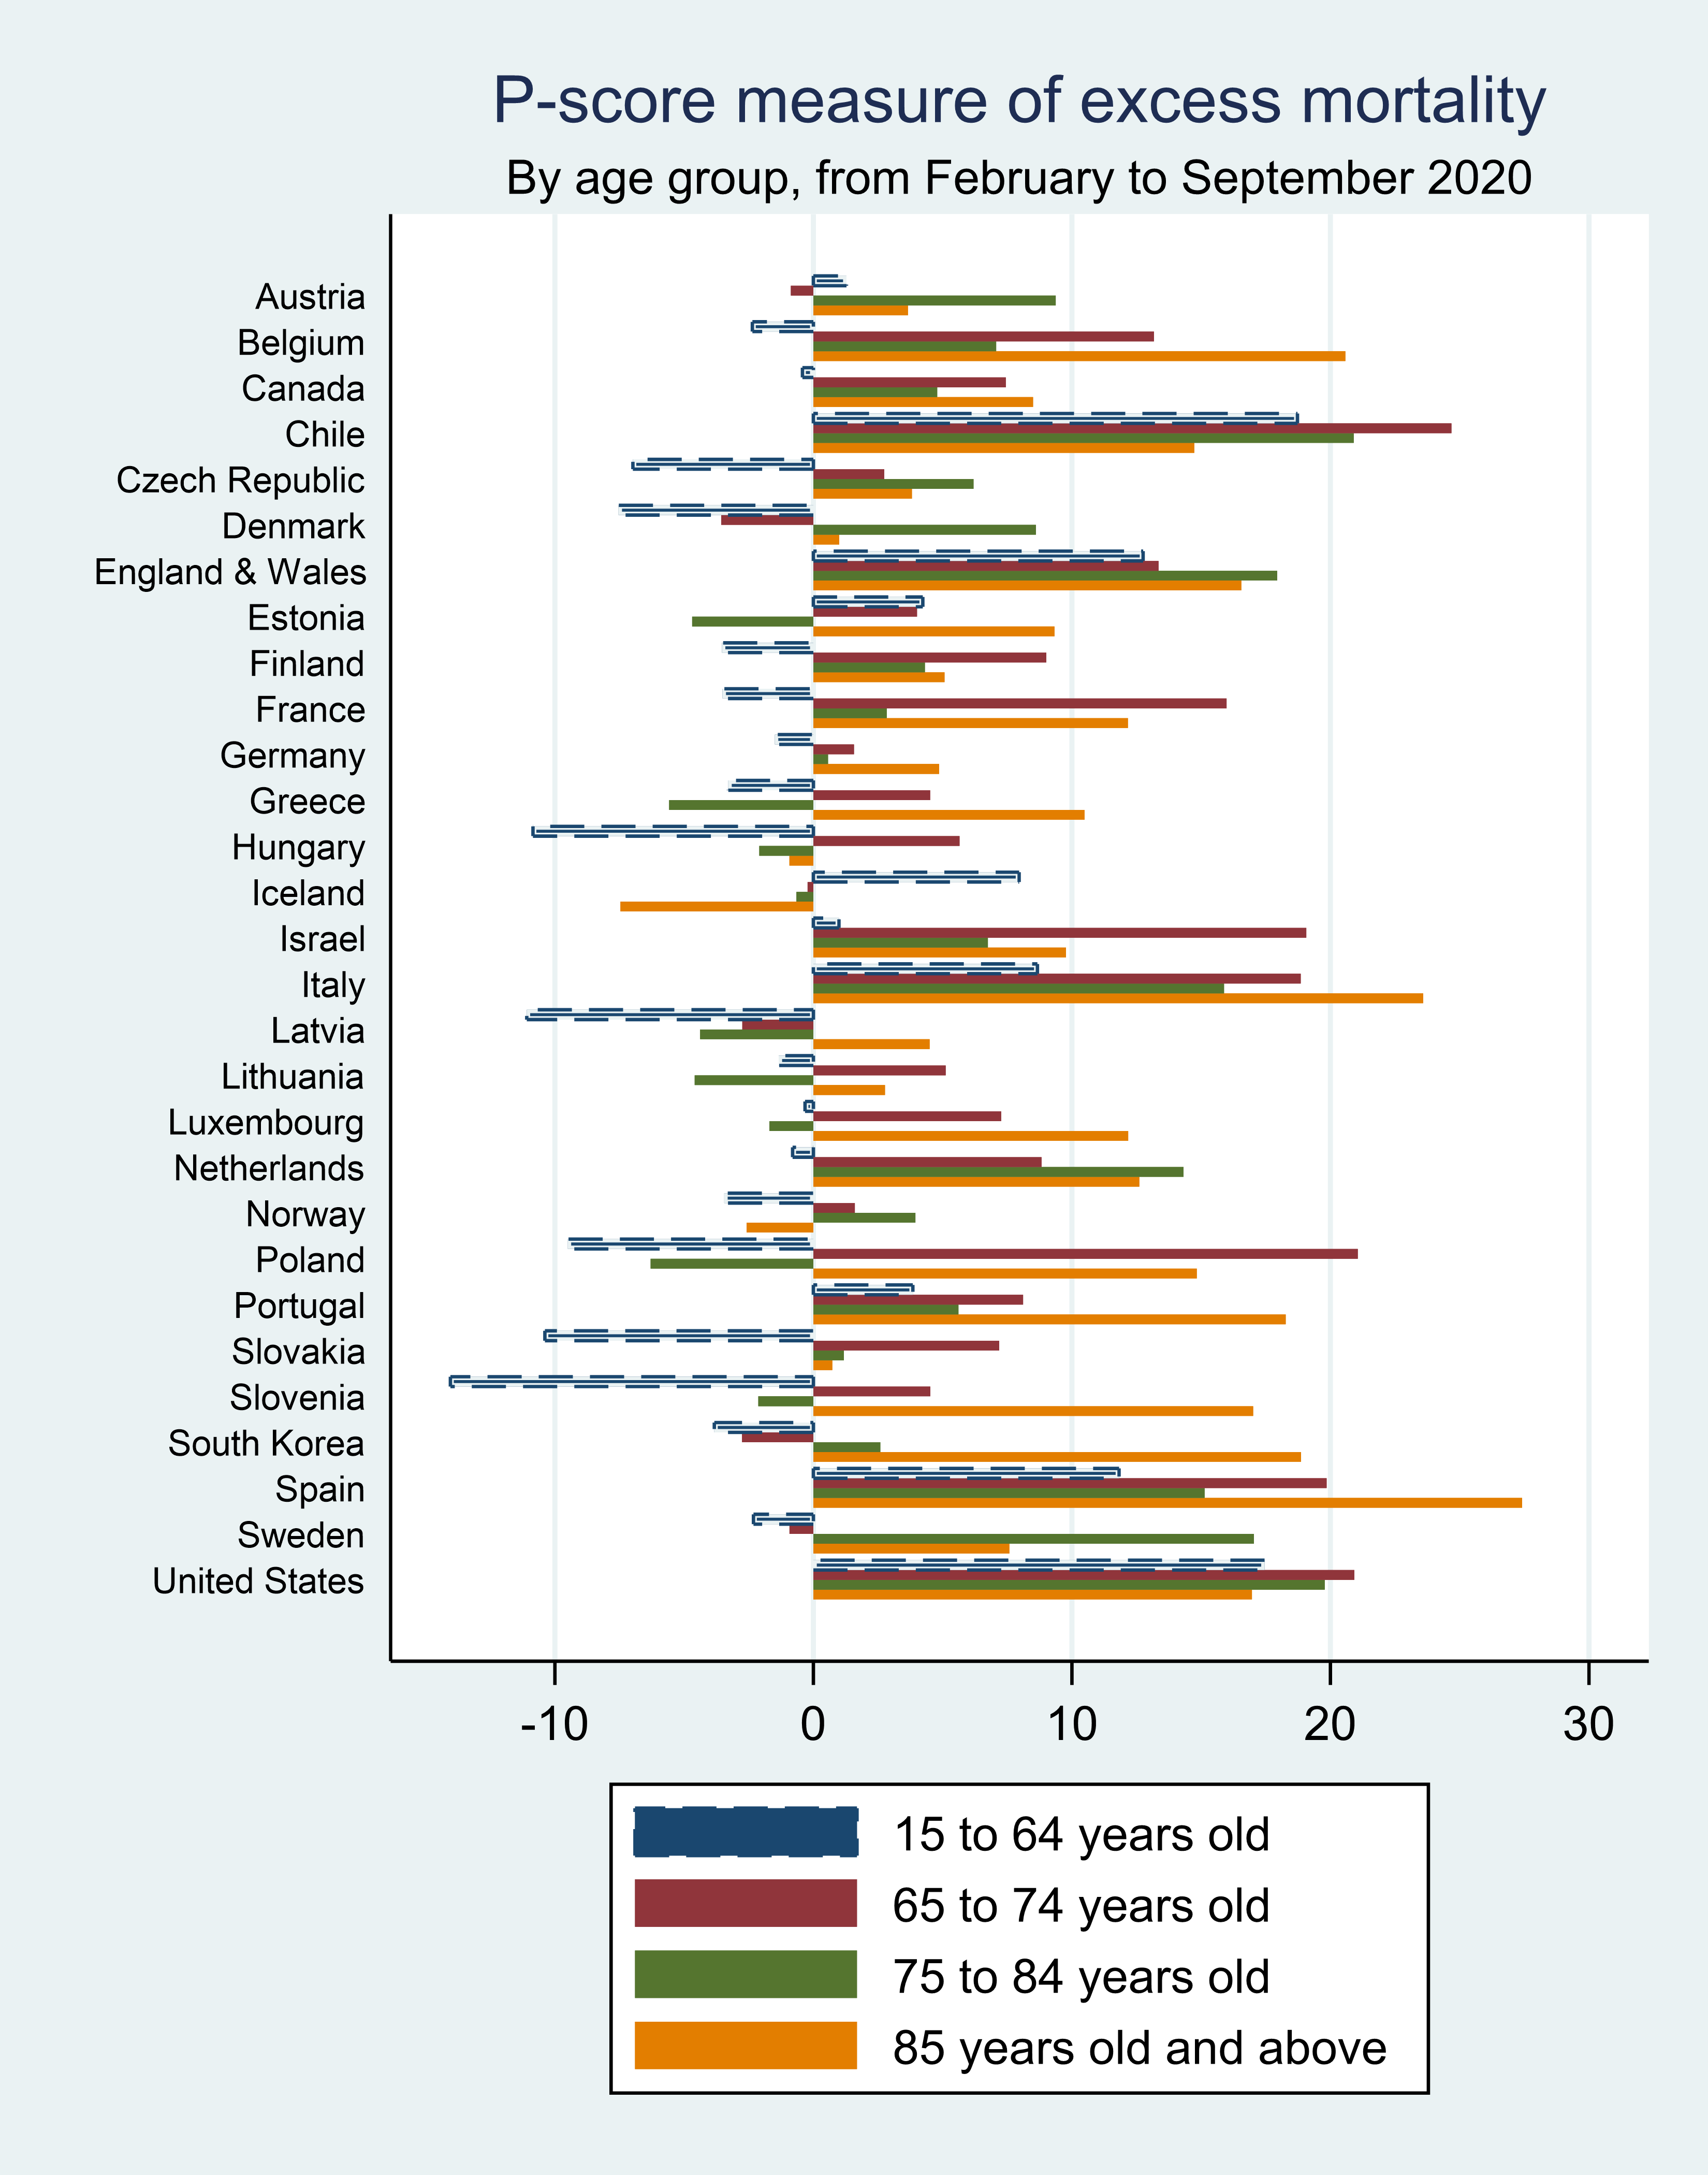
Finally, the heterogeneity is apparent when it comes to excess mortality by age group (figure 3): while some countries experienced the highest increases in mortality for the very old (85+), in others the figures were worst for the 65 to 84 age group, and we can observe both below and above average excess mortality rates for the 15-64 age group.
A pandemic ‘misery index’
Policy makers are therefore faced with a joint minimisation problem whereby they are trying to minimise both health and economic costs. It is in this respect worth keeping in mind that both are – at least in the medium to long term – intrinsically linked to one another. On the one hand, mass health issues end up undermining economic productivity and growth. On the other hand, economic decline, insecurity and deprivation generate health problems while also limiting our ability to fund health interventions.
If we combine our economic and health performance indicators into a single pandemic misery index (PMI), we can see that the peak in April hides significant cross-national variation as captured by the standard deviation, and that as the mean of the PMI falls, so does its standard deviation (Figure 4).
Figure 4: Pandemic misery index over time
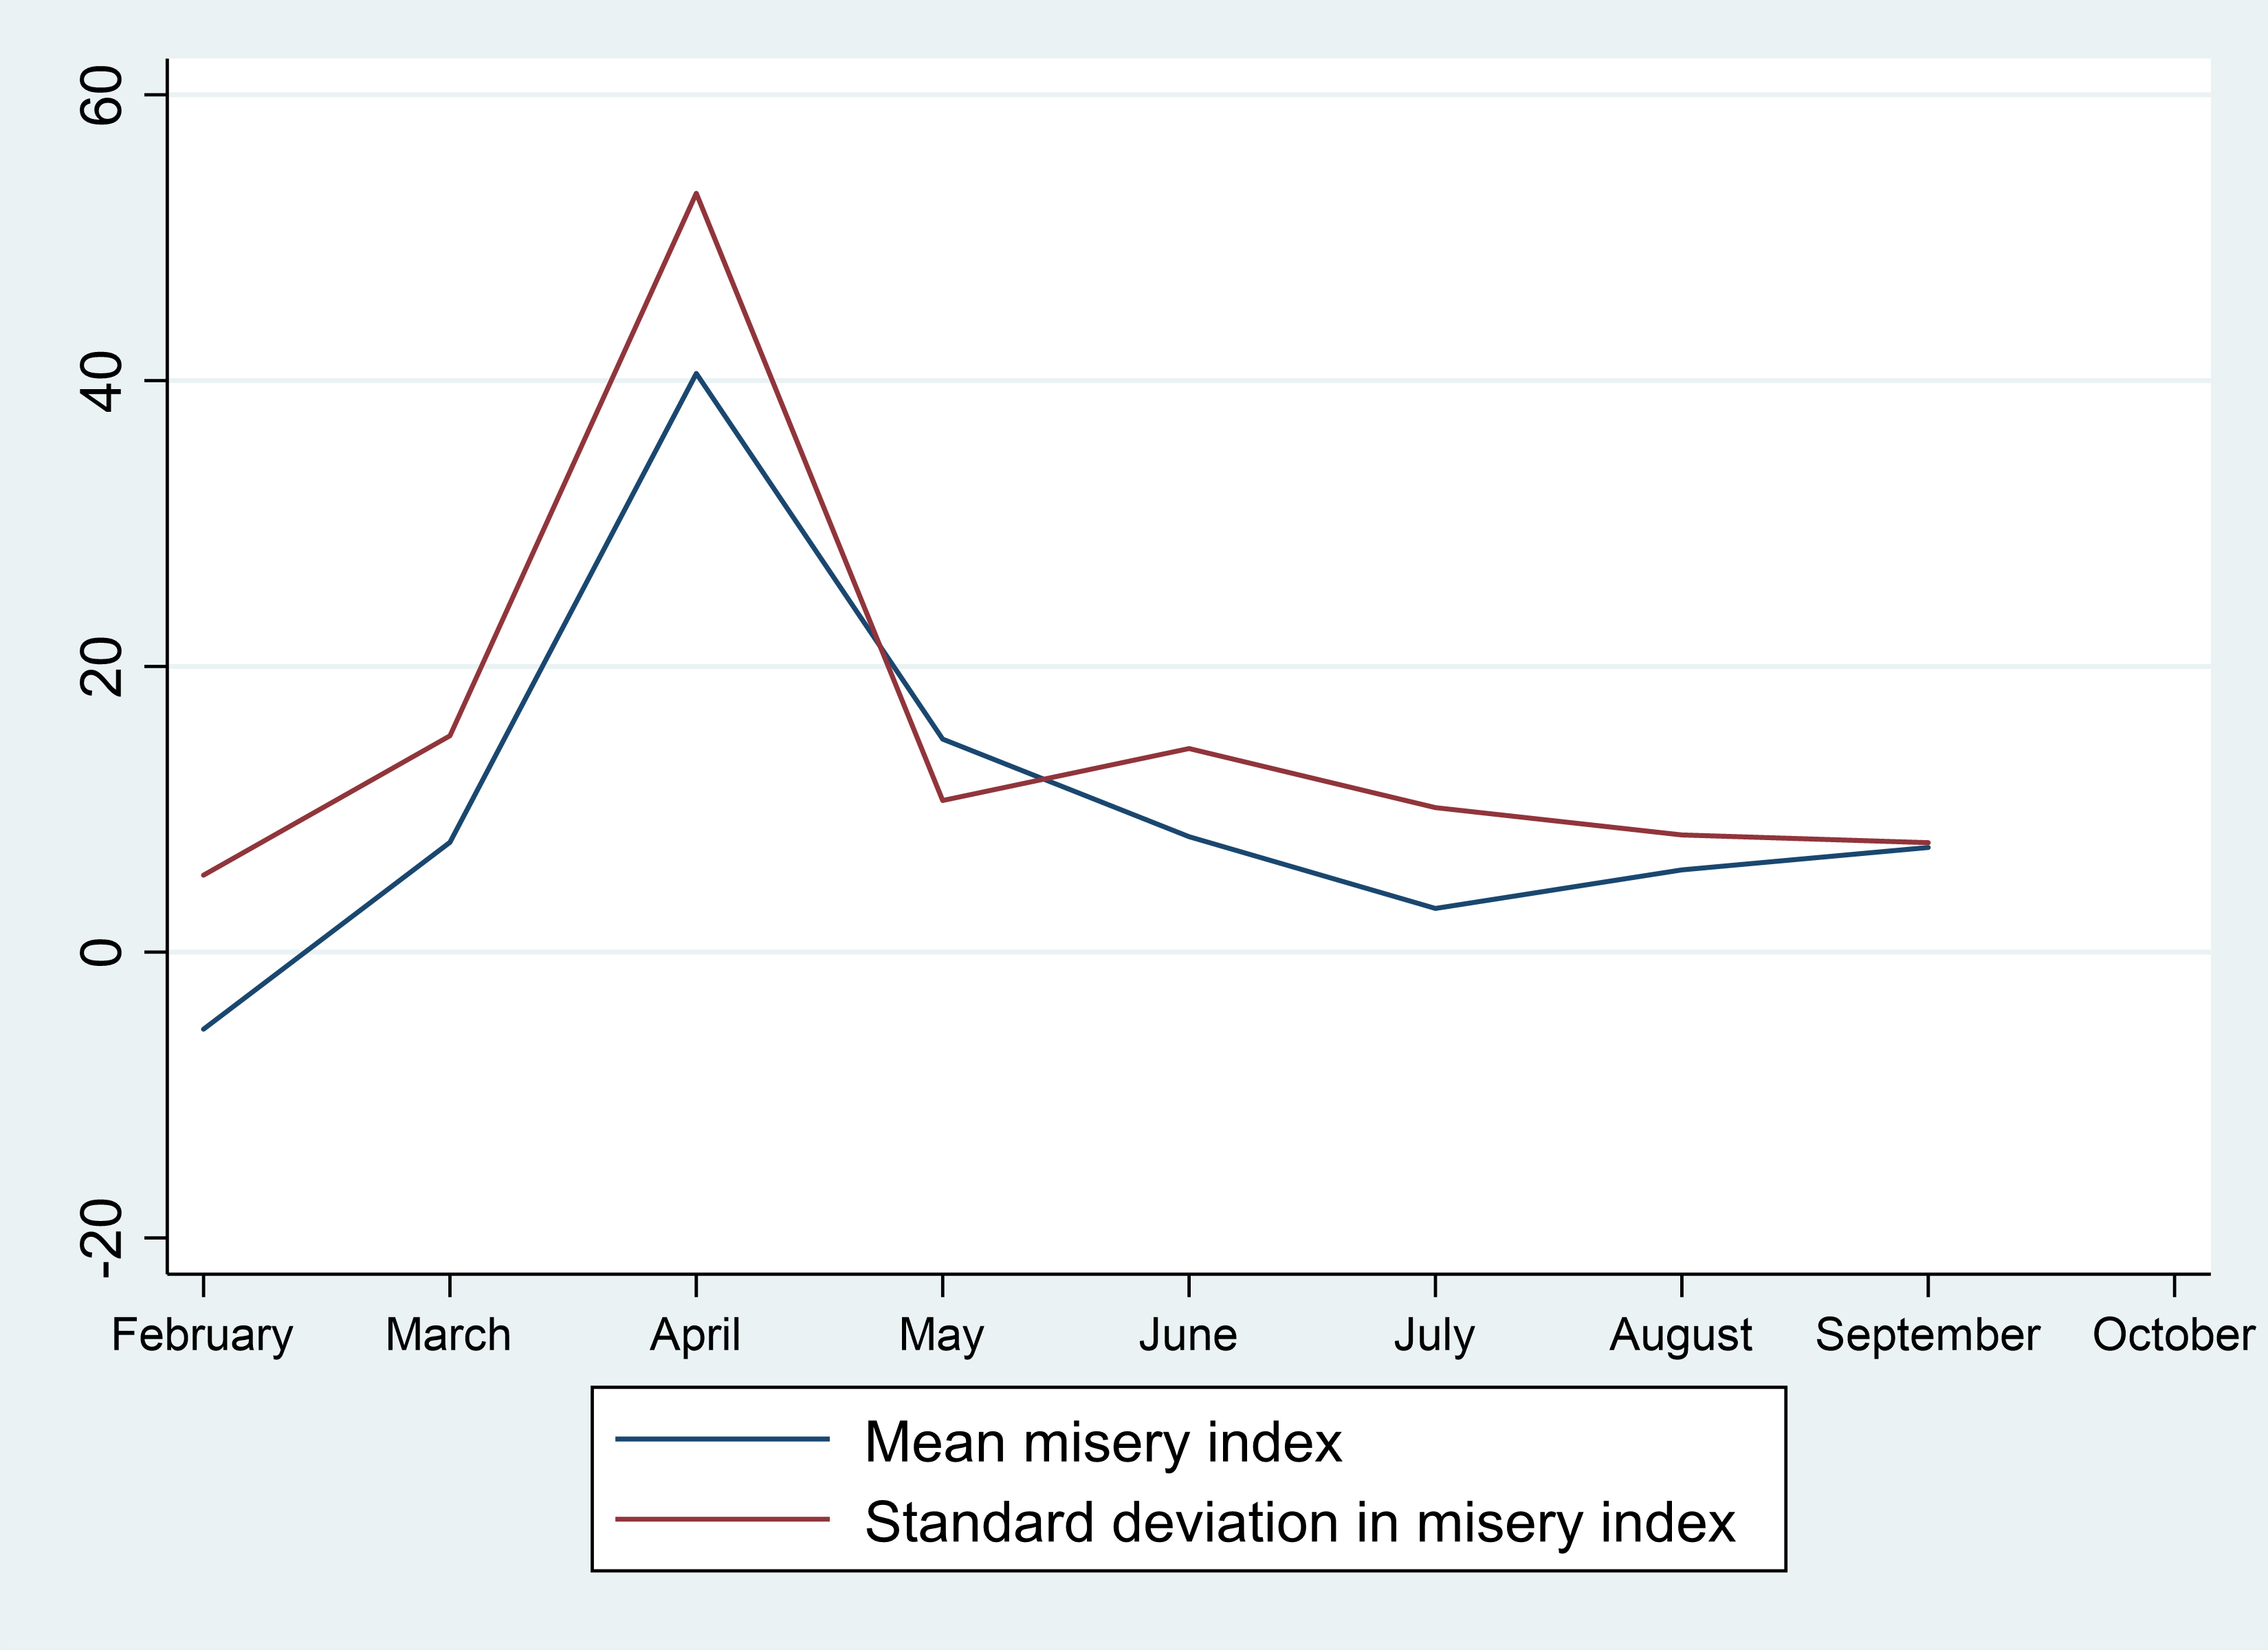
Note: The standard deviation statistic with weights returns the bias-corrected standard deviation, which is based on the factor sqrt(N_i/(N_i-1)), where N_i is the number of observations.
In Figure 5, I plot cross-national variation in the PMI. In the top worst performers, we find three liberal market economies (Canada, the UK and the US) and three southern European countries (Spain, Italy and Portugal). Although not in the top five worst performers, two small open economies in continental Europe – Belgium and Netherlands – also fared poorly.
Figure 5: Pandemic misery index across countries

Note: The pandemic misery index combines excess mortality with an increase in unemployment.
To assess what’s driving poor performance we can disaggregate the PMI along its two dimensions (figure 6): the PMI in Spain, Italy and the UK is driven by mortality rates with relatively mild increases in unemployment, compared to the US and to Canada, where the increases in unemployment were much more acute. Among the good performers, we find several central and eastern European countries, including Latvia, Hungary, and Slovakia; and also Nordic countries such as Norway, Denmark and Iceland. Sweden which followed a different approach than its northern counterparts did not contain unemployment better than Denmark nor Finland.
Figure 6: Disaggregating the pandemic misery index across countries

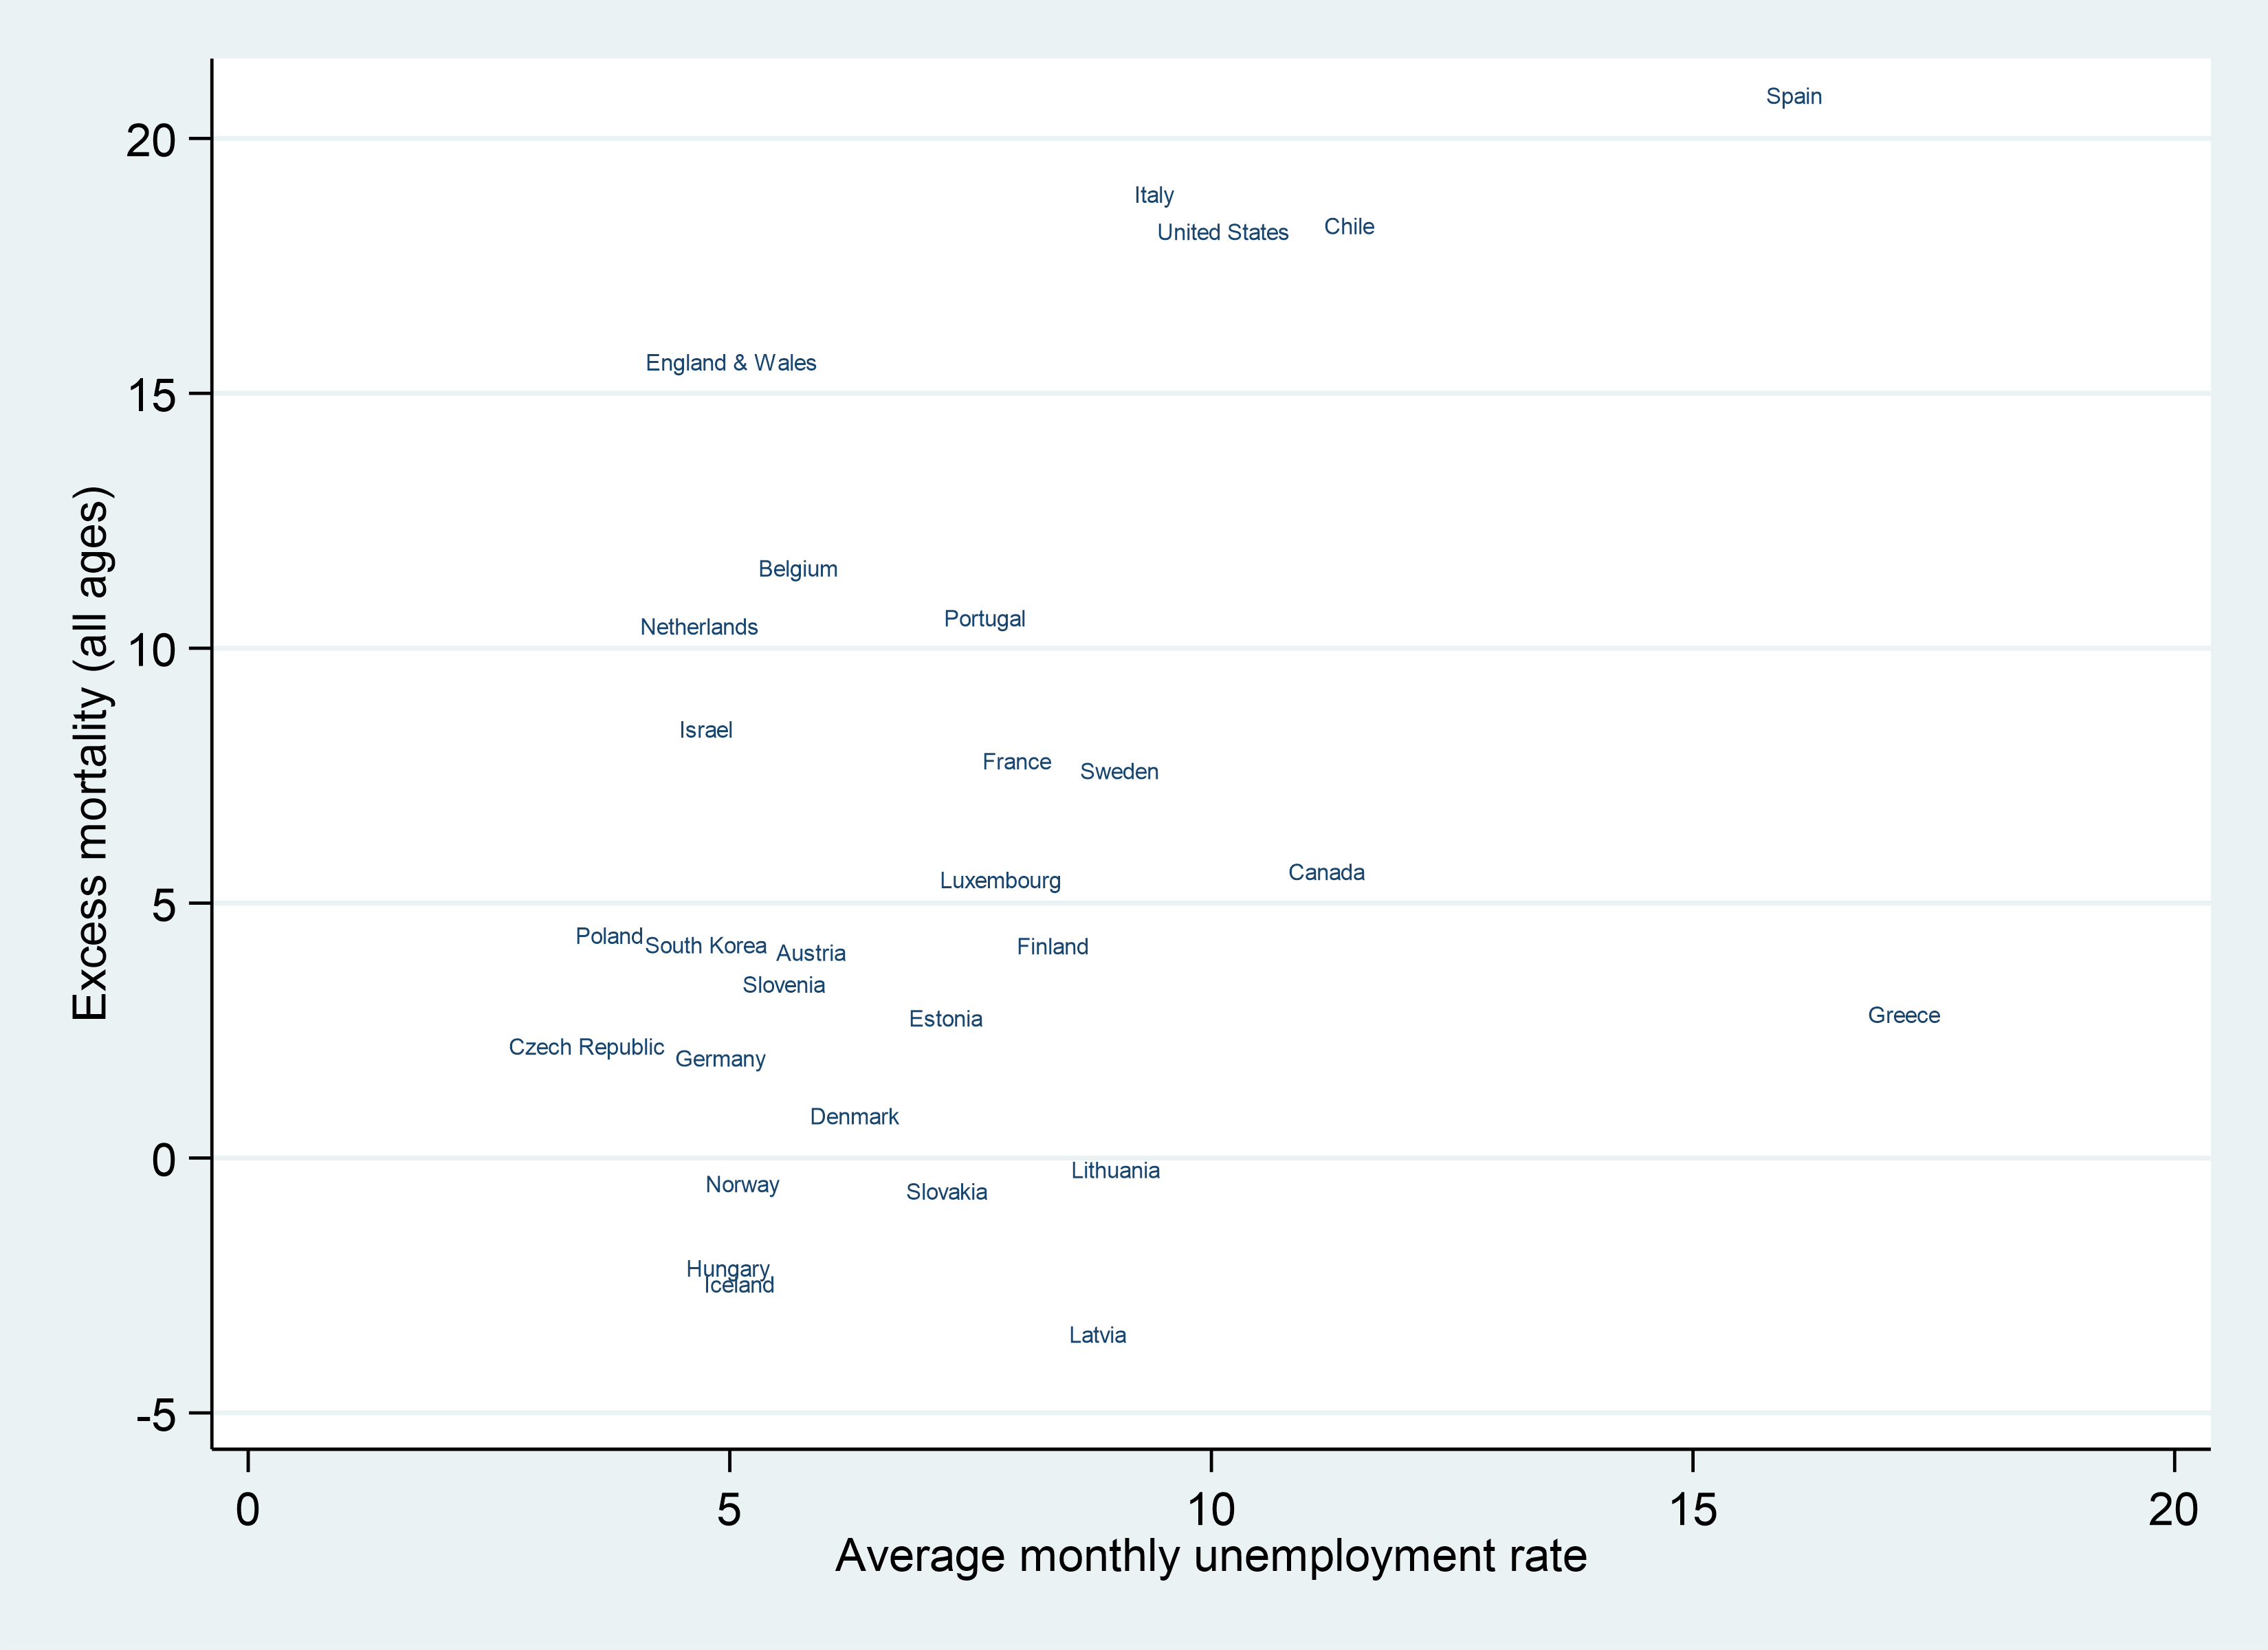
Of course, different countries started with different labour market positions, so plotting average levels (instead of changes) in unemployment rates, reveals a slightly different picture (Figure 7). Greece and Spain now look worst in terms of unemployment rate over the period, followed by Chile, Canada, the US and Italy. The Czech Republic, Poland, Netherlands, England and Wales, among others, kept a low unemployment rate.
Figure 7: Disaggregated PMI using levels in average monthly unemployment
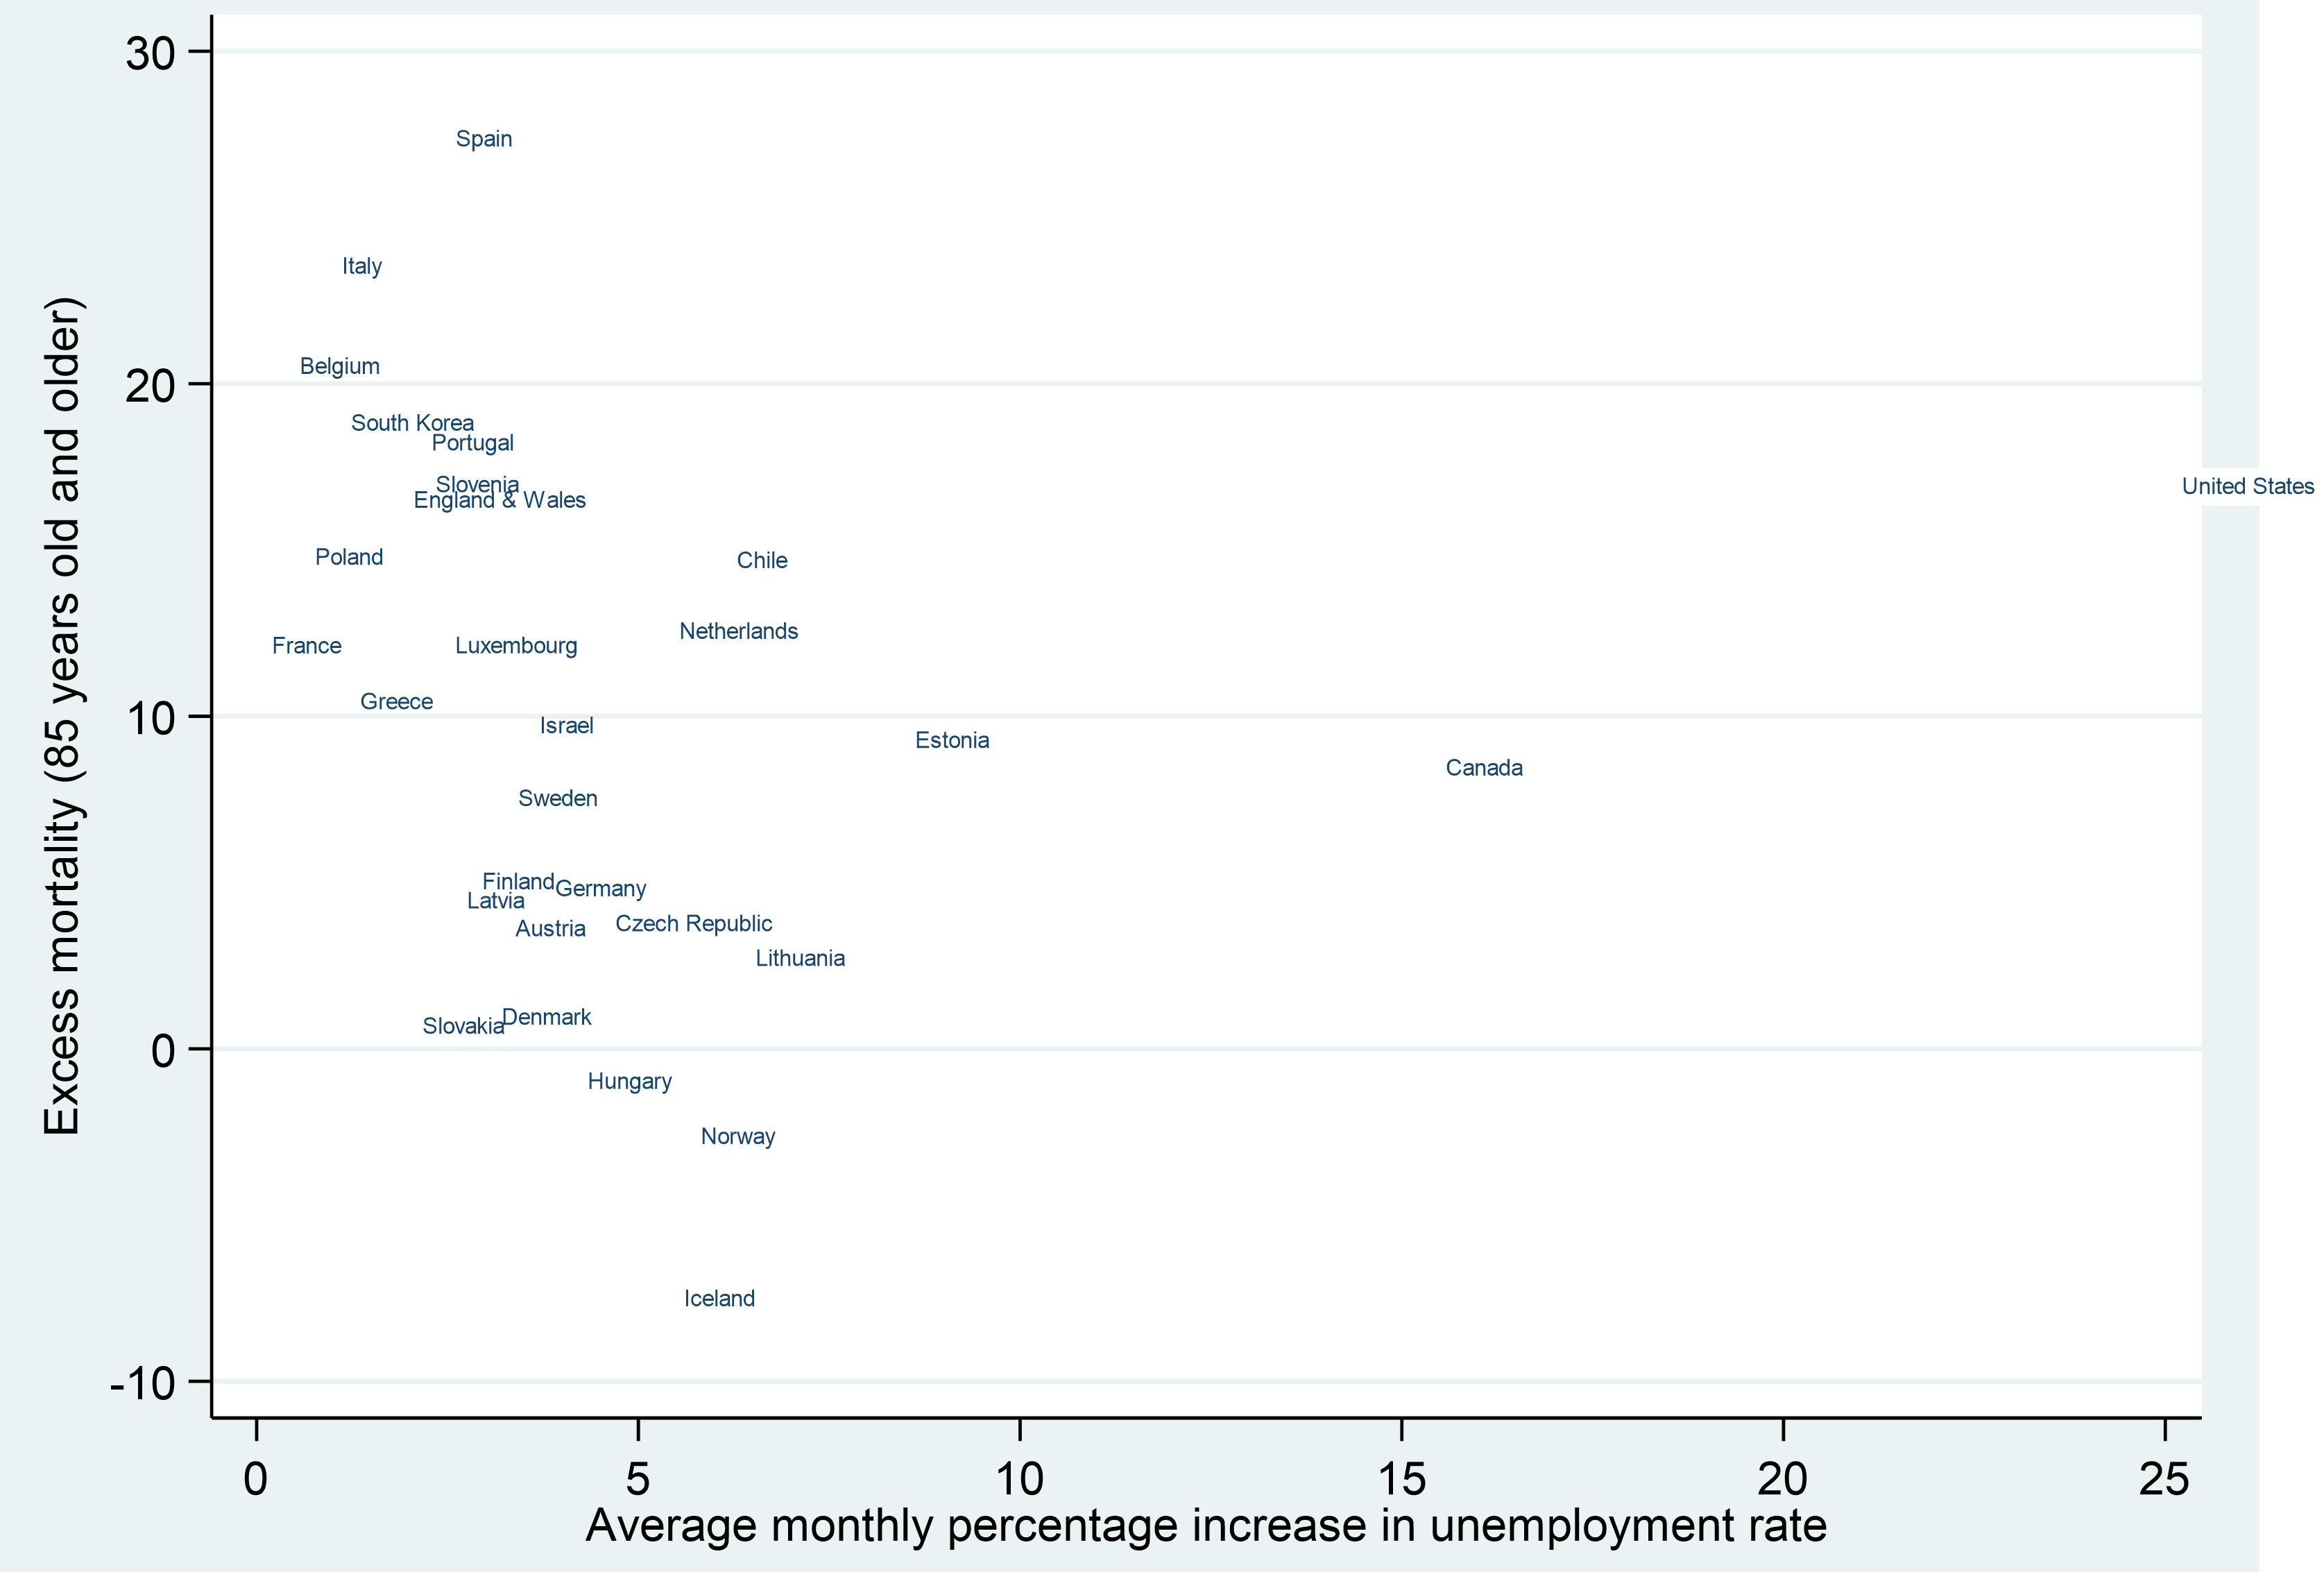
Finally, excess mortality among the very old (85+) reveals especially dire numbers for parts of southern Europe (figure 8), where there are more inter-generational interactions. However, we can contrast the experiences of Spain and Italy, and to a lesser extent Portugal on the one hand, with Greece on the other hand, which performed very well in the first wave of the pandemic. The US, England and Wales, and Canada score high but are not in the top 6 worst performers, while Iceland, Norway, Hungary, Denmark and Slovakia do especially well.
Figure 8: Disaggregated PMI using mortality rates for over 85 rather than all ages
Note: This article gives the views of the author, not the position of EUROPP – European Politics and Policy or the London School of Economics. Featured image credit: Marco Verch (CC BY 2.0)


God bless America…
On the basis of this analysis and other than purely descriptive statements, what can be said?
Tim, thanks for this analysis. I think unemploment is a misleading indicator of economic performance in this pandemic. It strongly depends on employment protection laws. Italy adopted a moratorium on firings, for example. No employee could be fired since March 2020. Also there have been extensive use of “cassa integrazione” which integrate salary for employee while keeping the job. In this way many firms avoided bankrupt because the government paid, sometimes in full, their employees’ salary. I think GDP change is more accurate metric.
And if talk about 3rd world countries Pakistan has done well in holding their economy and increasing the employment opportunities but starting productions for different industries.