In advance of the 5 May elections for the office of London Mayor and the London Assembly, Tony Travers and Martin Rogers analyse the issues which may influence the outcome, how demographic change may affect the result and which Assembly constituencies may change hands.
The London Mayoral race is among the highest-profile contests of the May 2016 elections. The Labour party candidate Sadiq Khan has, in recent polls, been running ahead of Conservative Zac Goldsmith, though the margin between the two (generally 6 to 8 per cent) is small enough to allow for a change between now and May 5.
A Labour City?
Following the 2015 general election and borough contests in 2014, 45 of the capital’s 73 MPs are Labour, 21 of 33 London Borough Councils are currently Labour-run, while 12 out of 25 London Assembly Members are Labour. There is some evidence that London is becoming relatively easier for Labour to win over time. The chart below compares the vote share in London with that for Great Britain in every general election since 1955.
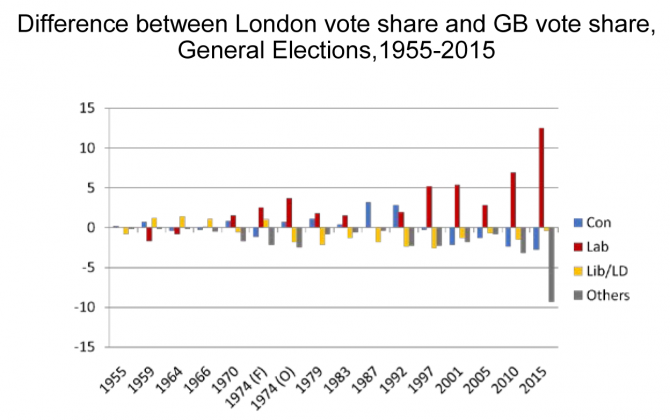
In all the years from 1955 to 1992, the Conservatives and Labour’s vote share in London was close to their country-wide share: Labour slightly ‘over-performed’ in the 1970s, while the Conservatives did relatively better than country-wide in 1987 and 1992. But from 1997 onwards, Labour’s vote share in London has (except in post-Iraq War 2005) been five or more per cent higher than across the country. In 2015, Labour in London out-performed their country-wide vote share by over 12 per cent. Most of this success has been achieved, in net terms, at the expense of ‘Others’.
How much do the candidates matter?
Boris Johnson, as a Conservative mayor, won the mayoral election in 2008 and 2012. Previous two-term success in Greater London elections was achieved by the Conservatives (led by Desmond Plummer) at the GLC in 1967 and 1970, and by Labour (more correctly, Ken Livingstone, who ran as an Independent in 2000) at the Greater London Assembly in 2000 and 2004. There is no term limit for either candidates or parties, but it is fascinating to note that neither of the major parties has ever won more than two consecutive terms in ten Greater London contests between 1964 and 2012.
How much do the candidates matter relative to party positions? Labour has done well in winning London MPs but Boris Johnson won two terms as mayor. Johnson has had an unusual capacity to reach out to voters in other parties that has triumphed over the growing electoral disadvantage for the Tories in the capital. With Boris no longer in the race, Zac Goldsmith will have to fight a particularly effective campaign to win over Liberal Democrat, Green and UKIP second-preference voters, especially with a Conservative government at Westminster.
Factors in Labour’s Favour
Labour has a large activist base to call on: the party has around 40,000 new members since the general election, over 1000 councillors, half of London’s assembly members and 45 Members of Parliament. This network of activists should provide a number of volunteers to canvass voters and take part in ‘get out the vote’ operations. Having said this, it is not at all clear that the new party members are signed up to walk the streets and take part in the slog of winning over floating voters.
Midterm elections are historically helpful for the opposition. Not only have the Conservatives been in office for six years (including the coalition) but the government has presided over a period of fiscal austerity which has proved challenging. The London mayor and assembly contests, by their relatively local nature, will focus on issues related (at least in part) to the implementation of such austerity – Councils have faced budget cuts of 35 to 40 per cent in real terms since 2010. Of course, these elections will not affect the makeup of London councils, but the issue of service cuts will inevitably play a part in the politics of the campaign.
Demographics
London would appear to be, in demographic terms, increasingly more favourable to Labour than to the Conservatives. Compared to England as a whole, London is on average younger, more educated and more ethnically diverse – all demographics which tend to favour Labour. Changes in the demographic composition of outer London will make it harder to operate the so-called ‘donut’ strategy used by Boris Johnson to secure Conservative votes in the outer boroughs. In 2014, the most recent available data, outer London is less white and less British-born than in previous years. These are demographic groups that have (overall) been less favourable to the Conservatives in London elections. The chart below explores a number of demographic trends in London.
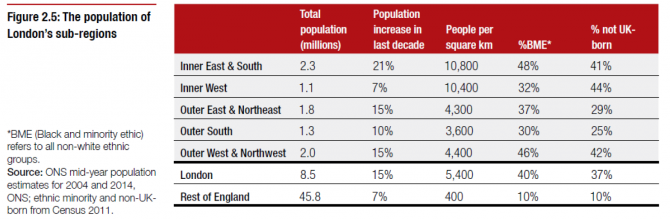
Source: London’s Poverty Profile 2015, p19
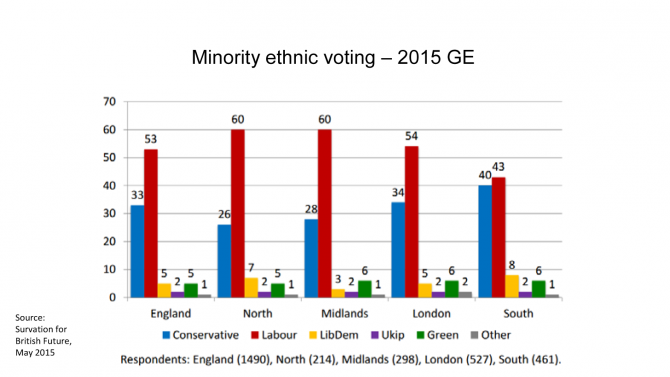
Having said this, it would be wrong to assume that the minority population will overwhelmingly vote Labour, or, indeed, that minority voters may not shift towards the Tories over time. The following chart shows (based on opinion polling after the election) a regional breakdown of minority ethnic voting in the 2015 election. In London and the South, a third or more of such voters supported the Conservatives in 2015, suggesting a likely movement towards the party compared to past elections. South Asian voters, in particular, appear to be increasingly willing to support Conservative candidates.
Zac Goldsmith
Whilst Zac Goldsmith is less well-known than Boris Johnson, he has a number of attributes likely to be appealing as a candidate for mayor. He has a history of independence from his party’s leadership and of taking positions different to his party which suggests independence from his party’s line. Goldsmith is a moderate, liberal, Conservative which should appeal to a broadly progressive city such as London. As the wider demographics of London change, more voters may find Goldsmith’s environmental credentials appealing. Indeed, Goldsmith is a good candidate to appeal to people (including some new Labour members) who may have voted for the Green party in the past. Goldsmith’s support for Britain leaving the EU may, however, counter some of these advantages with these groups.
Polling
Recent national opinions polls and the projections for National Equivalent Vote Share recently produced by Colin Rallings and Michael Thrasher of the University of Plymouth suggest that the Conservative and Labour parties are running neck-and-neck at the national level – see the chart below. If this proves to be the case on May 5, Labour’s London votes advantage should leave the party doing rather better in both the mayoral and Assembly elections than the national figures imply. The below chart implies a 3.5% swing from Labour to the Conservatives
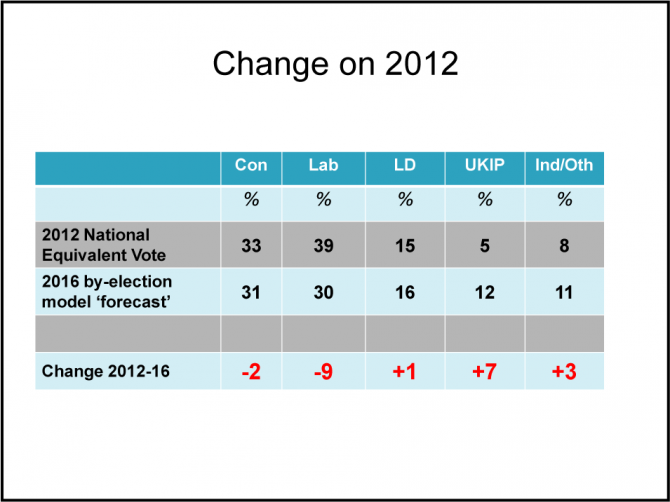
Source: Rallings & Thrasher’s NEVS projection from PSA Media Briefing 5th April 2016
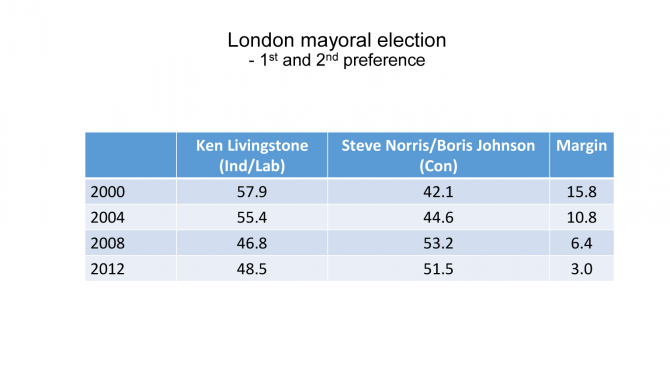
The margin (in terms of first preference and re-distributed second preference votes) between the two top candidates in the four previous mayoral elections ranged from 15.8 per cent in 2000 to just 3.0 per cent in 2012. Taken with the current polls, the past four elections can be taken as being suggestive that the race is likely to be a relatively close one.
Assembly elections
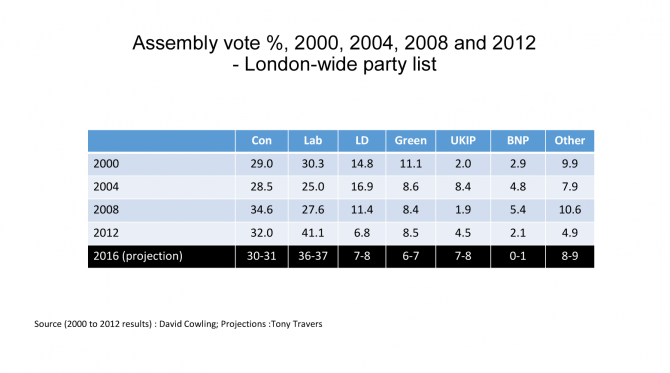
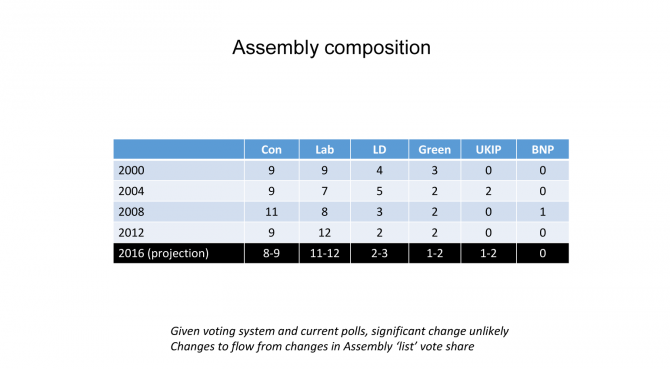
In addition to the Mayoral election, there will also be elections to the London Assembly which has a role in scrutinising the Mayor’s administration. The charts below show vote shares and seats won by the parties in each election from 2000 to 2012. ‘Projections’ of vote shares and seat numbers (based on recent polling) are shown, though these should be treated with great caution. It is important to note (as with the local elections in England) that these polls last took place in 2012, when the Labour party achieved a positive result.
The chart below shows each of the 14 ‘super constituencies’ fought by Assembly members, with the swing required to change it from one party to the other. There are only five marginal constituencies.
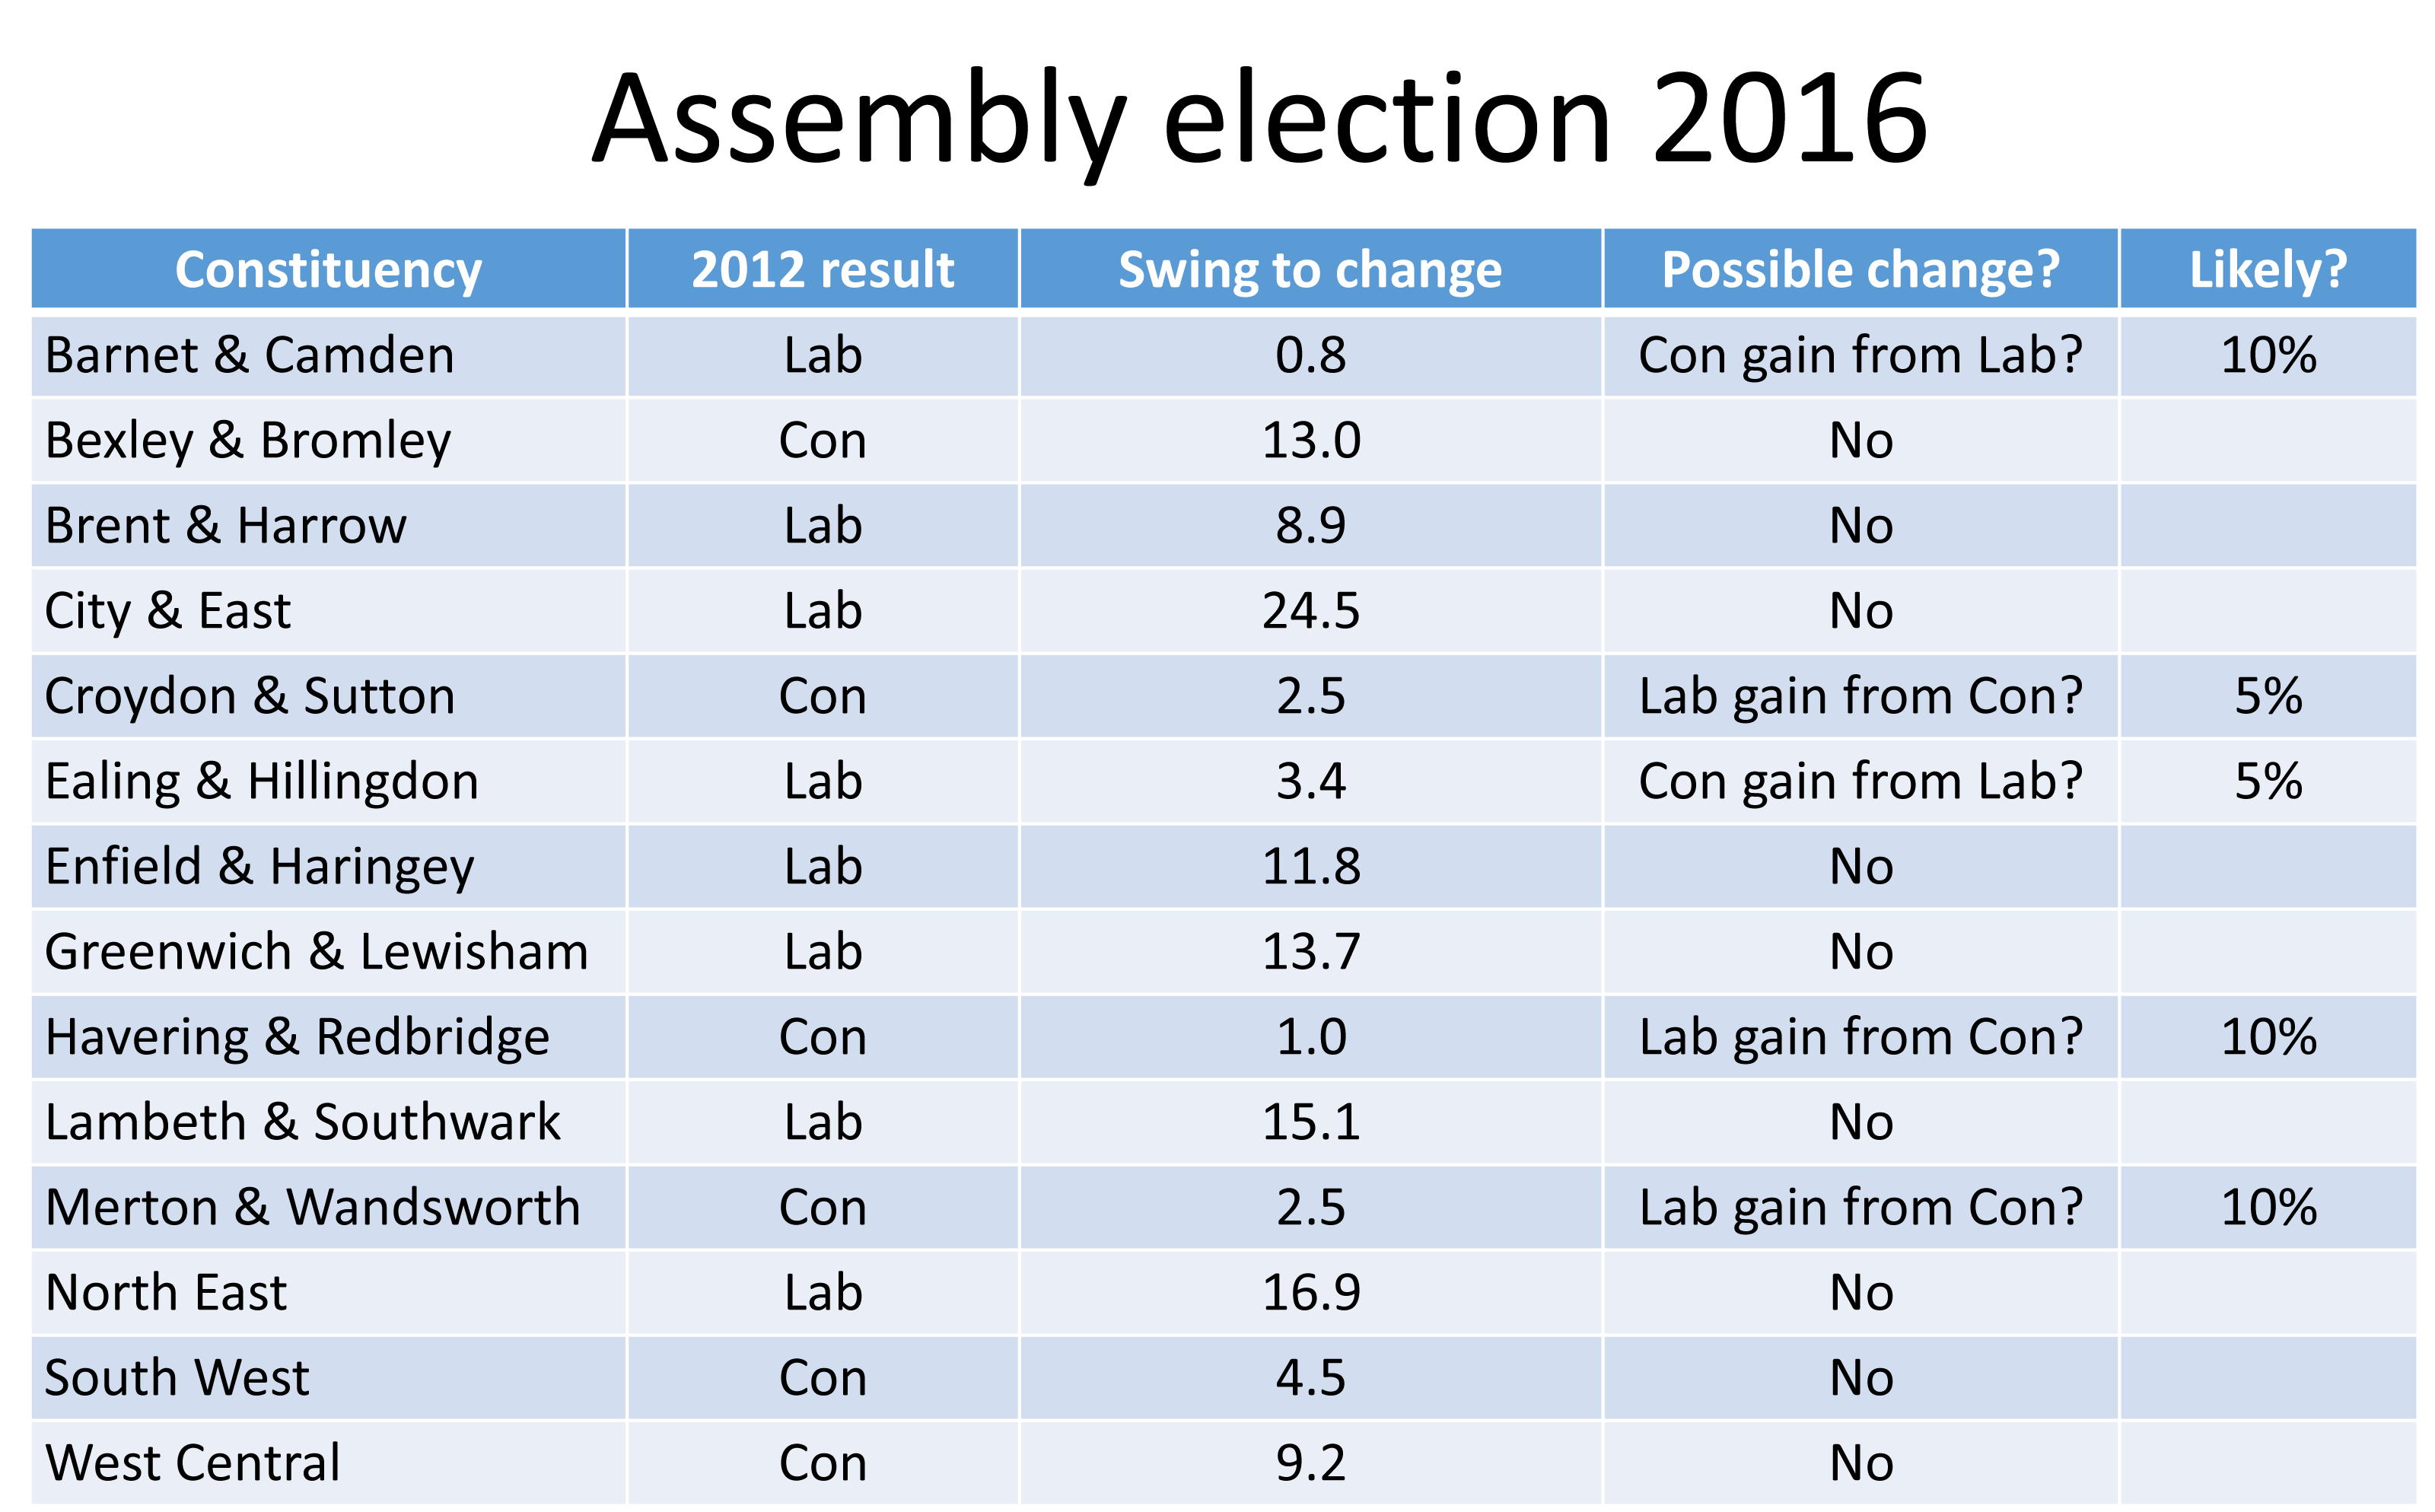
Of the boroughs with a small majority only Ealing & Hillingdon and Havering & Redbridge are likely to have seen the most significant demographic change. Due to the increased proportion of graduates in both of these super-constituencies, increased percentage of the population which identifies as BAME and percentage of the population born abroad, both constituencies may become more favourable to Labour. In the case of Ealing and Hillingdon this could move it from being a relatively marginal constituency to a safe Labour seat but because Havering and Redbridge is currently Conservative held, it is possible this seat may change hands.
In addition to the 14 super-constituencies, London voters can also cast a vote for a party in the city-wide ‘list’ election. The proportion of votes cast for each party in this Assembly ‘list’ election determine the final distribution of seats between the parties. The overall seat total will be broadly proportionate to the vote share for each party (using the D’Hondt system).
A Squeeze on the Green Party?
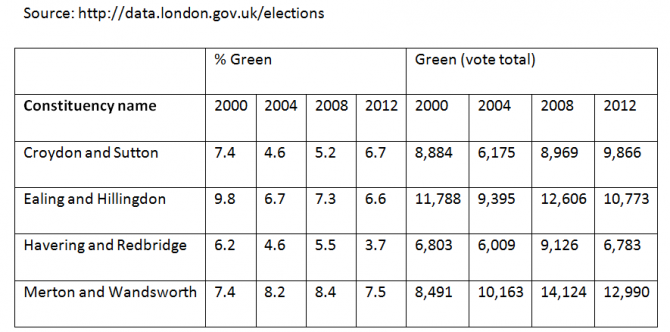
This table shows the votes for the Green Party in each constituency with a majority of less than 10,000 in previous GLA elections. Votes are given as a percentage of votes cast and as a raw number. Green votes will be very much up for grabs as the Corbyn-led Labour Party has adopted a similar left-leaning and anti-austerity position to the Green Party while Conservative candidate Zac Goldsmith has a history of environmental activism. Whichever party is best able to squeeze Green Party votes may thus benefit significantly.
Annex of electoral and demographic statistics
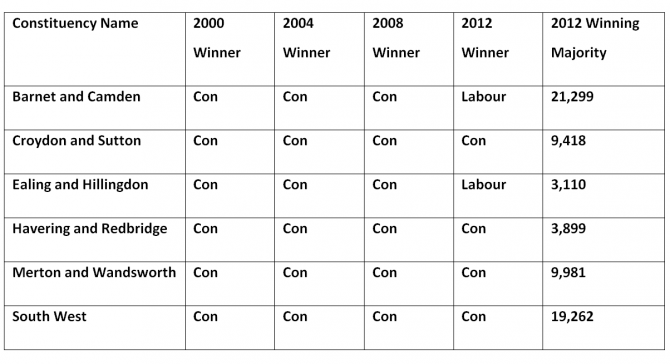
The table below shows which party or parties had previously held the seats and the winning majority in 2012. The super-constituencies shown are those currently most marginal which in this case is those with a 2012 majority of less than 22,000. These constituencies have been chosen because they are the constituencies with the greatest potential to change hands given the majorities from the 2012 election.
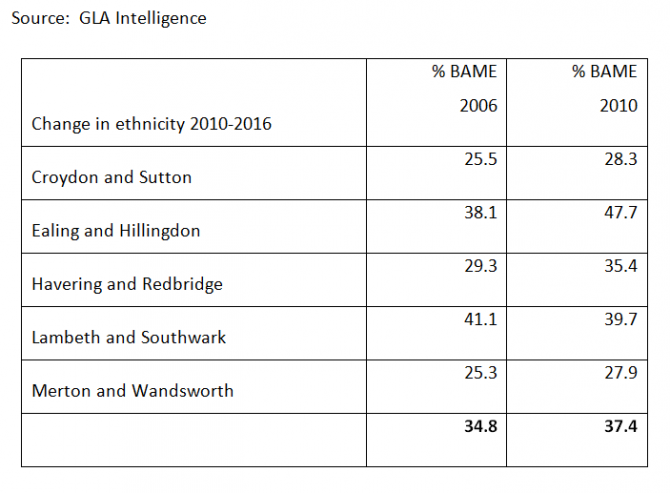
The next table outlines demographic change in constituencies where the 2012 winning majority was fewer than 10,000 votes. Specifically this table sets out the most recent available figures on the percentage of the population in each constituency which identifies as BAME. This data is relevant because certain ethnic groups have different voting tendencies. A more diverse population is likely to favour the Labour party though this may be changing, as discussed above.
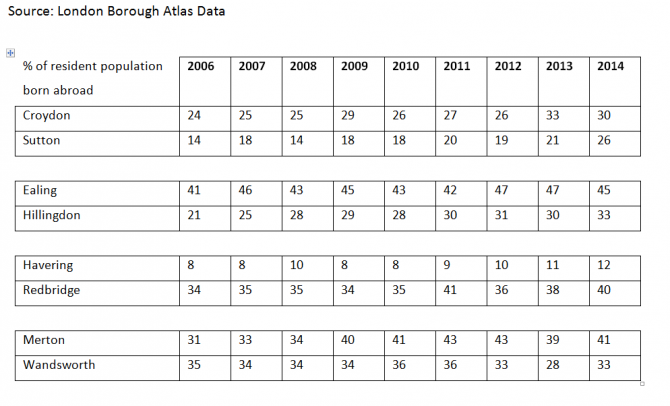
The following table shows the percentage of the population of each constituency born abroad by year. This data is of interest as those born abroad are more likely to vote for the Labour party as outlined above. These figures may therefore impact the outcome of the elections.
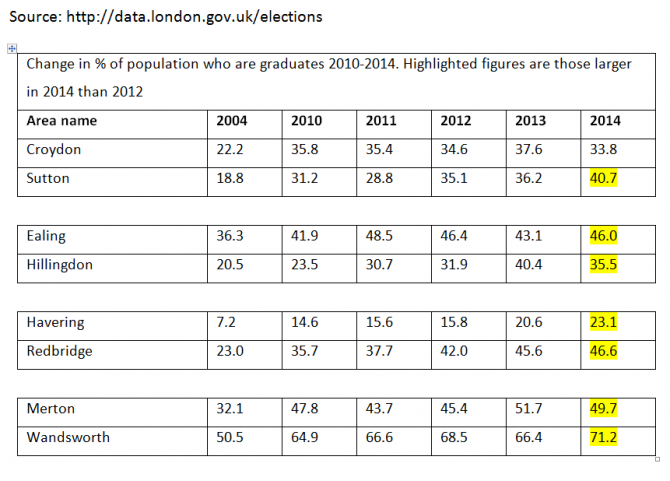
The final table details the change in the proportion of the population of each constituency who are graduates in years for which data are available. Graduates tend to be more favourable to the Labour party and so may impact on the result of the elections. The highlighted figures show where the percentage of graduates in the population has increased from the previous year’s figures.
 For the latest analysis of 2016’s electoral contests, go to UK Elections 2016 on GovBlog.
 Tony Travers is a Visiting Professor in the LSE Department of Government and Director of LSE London, a research centre at the London School of Economics.
 Martin Rogers is a recent graduate of the Department of Social Policy at the LSE and host of the LSE Department of Government’s video series The HotSeat
Follow Martin on Twitter – @MNBRogers


‘Assembly Election 2016’ table: ‘Lewisham and Southwark’ isn’t a constituency!
and also if it was (i.e. correct to Lambeth and Southwark), it would surely be LAB in 2012 no?
You are correct. That has now been corrected
That error has now been corrected