Ahead of the local elections on 5 May, Tony Travers looks at how National Equivalent Vote Share allows us to draw clearer conclusions from the results.
Opinion Poll Failure
The 2015 general election left Britain’s opinion polls facing a major review. Having strongly and consistently suggested Labour was likely to emerge as the largest party throughout the election campaign, the media and many commentators drew conclusions that proved to be false. Pollsters, who have a commercial interest in getting such things right, now face a nail-biting wait in the run-up to the European referendum.
For weeks, phone polls have generally shown ‘remain’ in the lead, while many internet ones have marginally shown ‘leave’ ahead. Unless the different methods converge to the correct result by June 23, there will be another polling ‘failure’. Even if things turn out well for the pollsters next month, the 2015 disaster will continue to haunt them.
Polling Methods
Methods used to weight the results which start with stratified samples of 1000 or so individuals have been made much more sophisticated over the years. Advanced statistical techniques have been used not only by pollsters, but also by academics and other experts who take polling as the starting-point for more detailed, constituency-by-constituency, forecasts of results.
If the polls fail to predict the result, forecasters are unlikely to do so. In fairness, opinion polling companies can only test views at a point in time. When a significant number of marginal voters make up their mind on polling day, there is always a risk they will produce a statistically significant change to the result. It is also possible that factors used to weight the results are skewed by a changing capacity on the part of those polled to report their voting behaviour accurately. People regularly over-estimate their likelihood to vote.
Local Elections – national issues?
Local elections, however, remain an annual test of real, rather than predicted, electoral opinion. In England and Wales, the first-past-the-post voting system is used for Parliament. While, of course, it remains important that these council polls are seen as a measure of local judgement about councillors, it would be naïve to pretend that they do not reflect the popularity or otherwise of the national parties.
What Is National Equivalent Vote Share?
After all, the parties have the same names at local and national level, while the UK remains (in each of its separate nations) highly-centralised. A vote for a council is, sadly, also a vote about Whitehall. Against this background, the ‘national equivalent vote share’ (NEVS) estimated by Colin Rallings and Michael Thrasher of the University of Plymouth, is a potentially useful gauge of national political opinion in the years between general elections. The NEVS uses the votes cast in a particular set of elections and adjusts them to take account of the pattern of contests in that year. The NEVS therefore provides a snapshot of country-wide voting preferences, regardless of where council elections are held.
Earlier analyses on the LSE blogs and elsewhere, notably Matt Singh at Number Cruncher Politics, have considered how far the NEVS might provide a useful indicator of future.
What can NEVS tell us?
As the 2016 local elections approach, how might the political parties and commentators interpret the NEVS figures produced once the votes have been counted?
The table below expands on earlier analyses by considering both the government and opposition performance in local elections in the years between general elections throughout the period from 1979 to 2015.
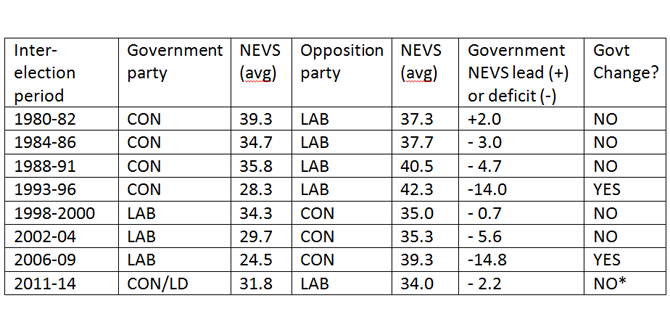
The simple average NEVS for the government and Opposition party is shown for each inter-election period. In 2011-14, the Conservative vote alone (within the Coalition) is shown. The difference between the two sets of NEVS figures is shown in the penultimate column. The final column shows whether there was a change of government in the next general election. The 2015 result is shown as ‘no change’, when, of course, the Coalition ended and was followed by a Conservative majority government.
The 14 percent lead challenge
However, the results are stark. There was a change of government between 1979 and 2015 only when the inter-election NEVS average was 14 per cent or above. Labour now faces the challenge of producing an average NEVS in the 2016-2019 local elections which exceeds the Conservatives’ NEVS by an average of 14 per cent per year. If the 2016 NEVS difference was very small, Labour would face the need of producing spectacular results in 2017, 2018 and 2019.
Of course, cast-iron electoral rules are made to be broken, especially as Britain moves (haltingly) away from its traditional two-party system. Nothing is forever, including apparently predictive electoral analyses. But it is hard to see Labour moving easily from a NEVS in the low-30s in 2016 to a resounding general election win in 2020.
 For the latest analysis of 2016’s electoral contests, go to UK Elections 2016 on GovBlog.
 Tony Travers is a Visiting Professor in the LSE Department of Government and Director of LSE London, a research centre at the London School of Economics.


The past analysis spans a time when there were the traditional parties and not much else. However, having had the referendum in Scotland there are different dynamics with the nationalists. Elsewhere, we have UKIP taking votes from other parties in a rather unpredictable fashion, and the local elections took place against a backdrop of the European referendum. I’m very doubtful given these new dynamics that a statistical analyiss of previous elections is particularly relevant. Hm… Did anyone mention polls before the last general election?
I don’t understand how this dataset leads to the conclusion that anything less than a 14% lead in NEVS means no change of government at the next election. Surely it suggests 14 percent or more will be enough, 5.6 percent or less won’t be enough, but doesn’t give any indication of where the “real” threshold lies in between?