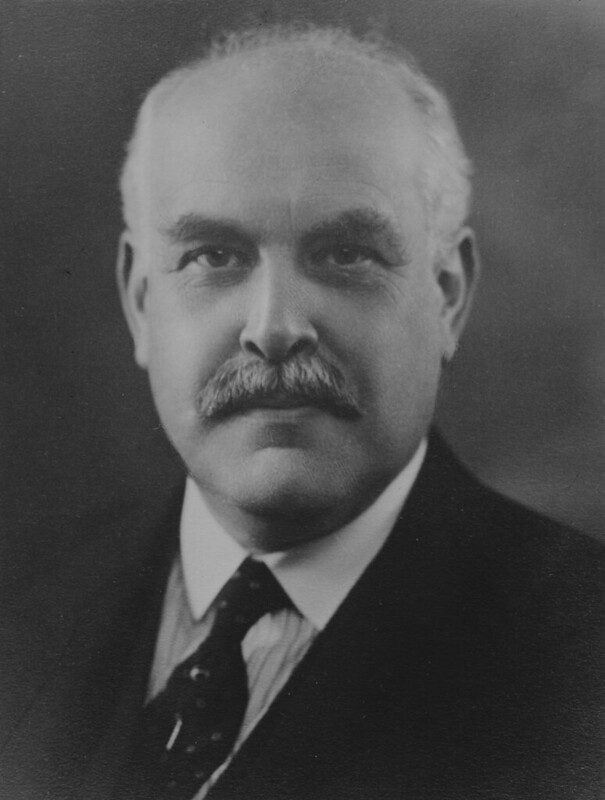
The Land Utilisation Survey of Britain was set up in 1930 by Sir Dudley Stamp, then Reader in Economic Geography at LSE, and many of the maps are in our archives. LSE Library’s Anna Towlson explains how the Survey came about and its lasting impact in postwar Britain.
Sir Dudley Stamp’s aim was to undertake a detailed field-by-field survey of England, Wales and Scotland to find out exactly what the surface of the land was being used for. The idea grew out of his work as Chairman of the Regional Studies Committee of the Geographical Association in the late 1920s. British agriculture had been facing a long and severe depression, mainly because of the increase in world food supplies and competition from cheaper producers. Many towns and cities had been growing at a steady rate since the industrial revolution, with low profits and low wages in the countryside speeding the drift of labour from the land. The Second World War would shortly change the shape of British agriculture dramatically. The Land Utilisation Survey therefore records the landscape of Britain at a very particular and distinctive time, at the nadir of a severe and prolonged slump, during what Stamp later described as “the tragic age of British farming”.
Stamp felt it was important to collect land use information at a national level for two reasons:
- To help with future land planning exercises. Stamp saw the land of Britain as a precious and limited resource and believed that careful planning on a national level was needed to ensure that it was being used to its maximum potential and not wasted.
- To serve as a historical record of land use at a particular time, so changes over a long period could be traced and analysed.
Stamp envisaged the Survey as acting as, in his phrase, a “modern Domesday Book”. This comparison caused some confusion at the time, in that it led some people to think that the Survey was part of a large tax-gathering exercise. But in many ways it is very apt: it was a comprehensive national survey that was designed to be of contemporary use as an administrative tool, but it also formed a permanent record of the country’s landscape at a particular time, something that is now of enormous historical value.
Stamp envisaged that much of the field work would be done by volunteers, mainly children from local schools and colleges. He also saw the project as a national educational exercise, an opportunity to interest young people in their local environment, to develop their observational and map reading skills, and to give them what Stamp called “a training in citizenship”, with each region playing its part in a nationwide scheme.
So that was the thinking behind the survey, but how was this ambitious scheme organised and implemented?
Organising and implementing the Land Utilisation Survey
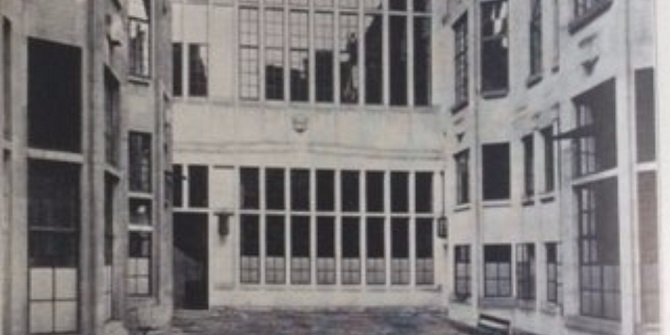
The Survey had no connection with any political party and although the Ministry of Agriculture knew about Stamp’s plans and approved of them, the project was not supported by government funds. Indeed Stamp strongly asserted the Survey’s independence from government, as he was anxious to dispel rumours about hidden official motives. But he did gain approval for the project from a wide range of organisations, including the Royal Geographical Society, the Boy Scouts Association, local councils and local education authorities. He also received an initial grant from the Rockefeller Foundation, via LSE’s Rockefeller Research Fund. The project was promoted to the public through the BBC and national newspapers, while the Ordnance Survey agreed to provide base maps for the fieldwork at a discount rate, and LSE provided space for a head office at their central London site.
During the spring of 1930 Stamp drew up a land classification system: this needed to be applicable to the whole country so that it would facilitate comparisons between different regions, but simple enough to be understood and applied by people with little or no formal training.
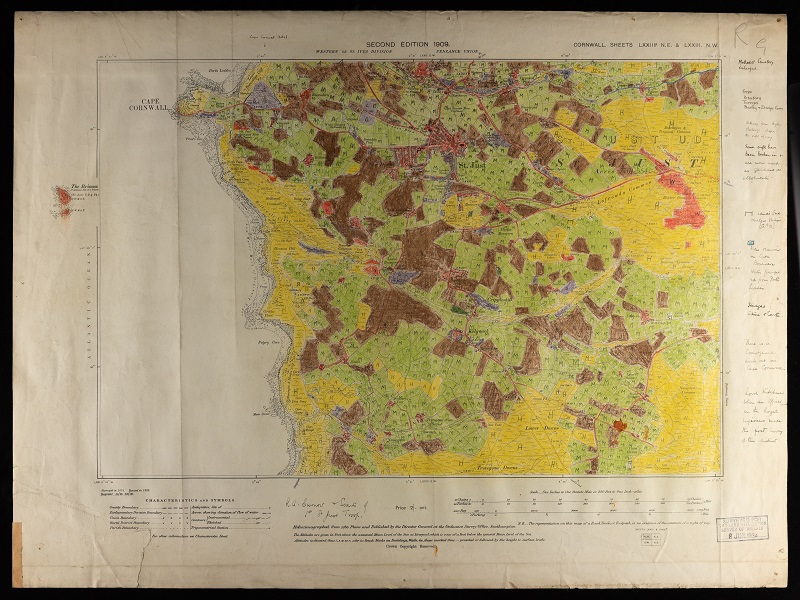
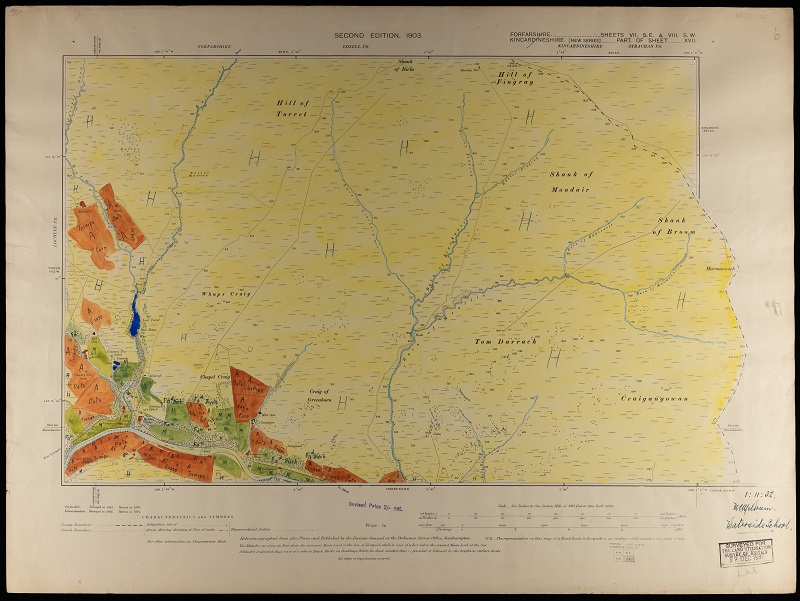
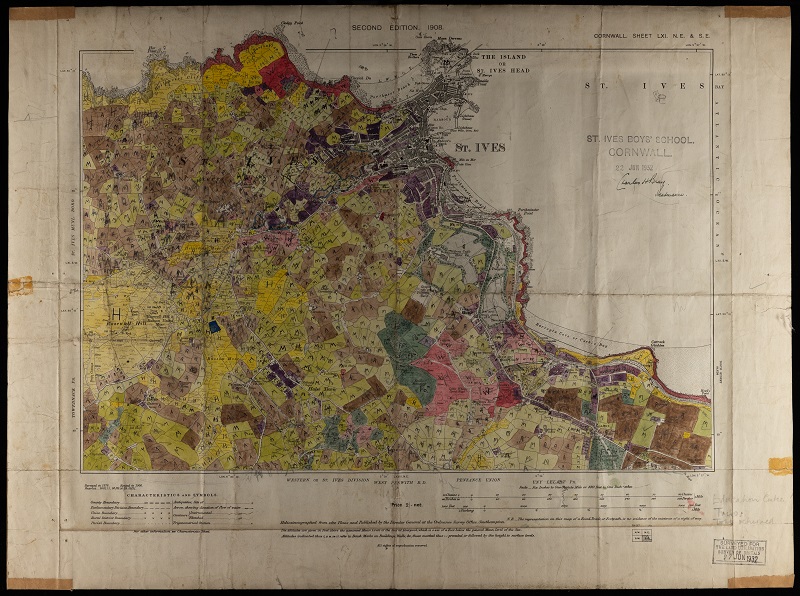
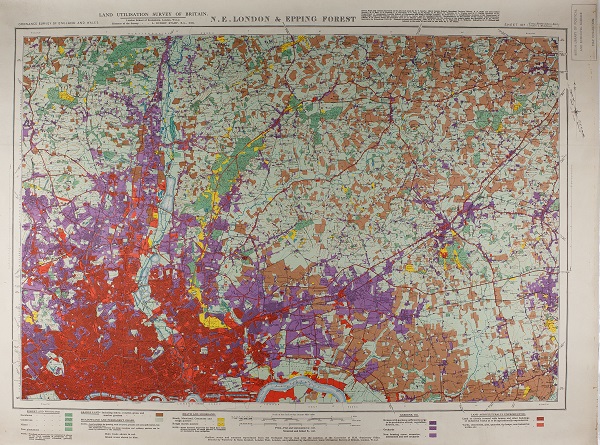
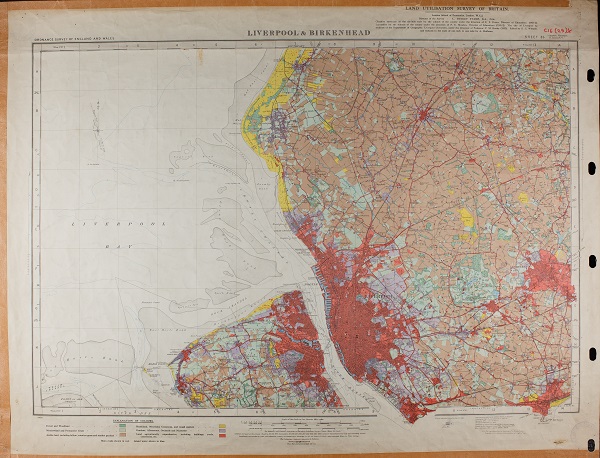
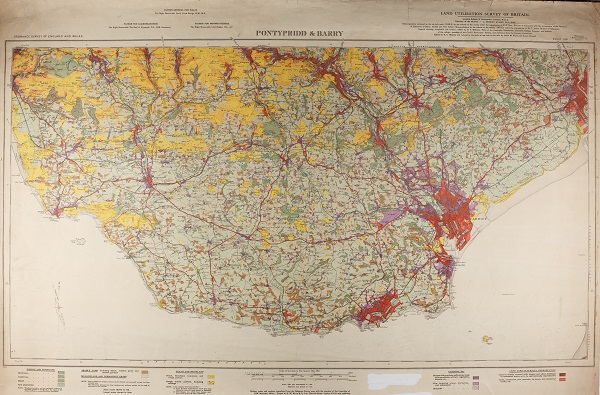
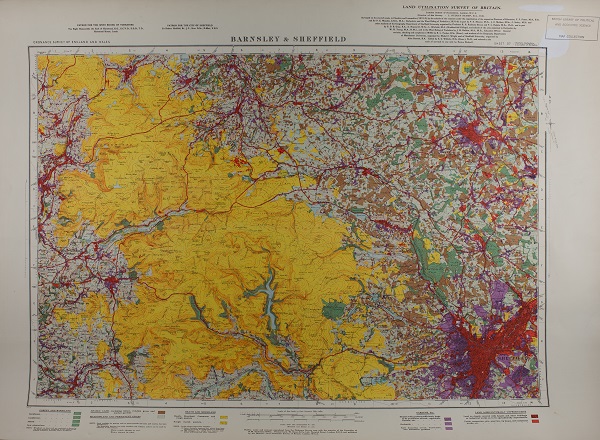
He devised a scheme of seven main categories, each represented by a different letter and colour:
- F and dark green: forest and woodland.
- M and light green: meadowland and permanent pasture.
- A and brown: arable or tilled land and market gardens.
- H and yellow: heathland, hill pasture, commons and moorland.
- G and purple: gardens, allotments and orchards.
- W and red: built-up areas, quarries, waste tips, industrial buildings or cemeteries. Stamp originally described this category as wasteland (hence the initial W), but he changed this after a fellow geographer pointed out that this kind of land was often used productively, just not for agricultural purposes.
- P and blue: ponds, lakes, streams, rivers and other bodies of water.
Stamp decided that the fieldwork for the Survey should be organised on the basis of the existing administrative counties of the country, and so in autumn 1930 he contacted the directors of education in counties across the whole of Britain to explain the project and ask them to coordinate work in their areas. He then spent the next year touring the country to talk to head teachers and education committees and taking out parties to demonstrate field work methods. He estimated that in this first year he covered almost 2,000 miles a month, with his wife acting as chauffeur. By mid-1931, the Survey was underway in most counties in England, and by early 1932 in Wales and Scotland also.
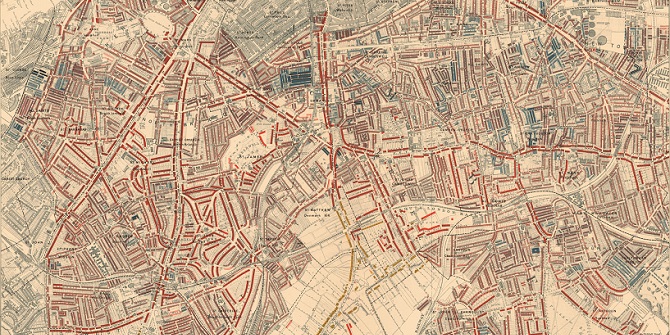
The Survey published a sheet of instructions for volunteers outlining the classifications and giving examples of how they should be used. Volunteers then visited the areas they were covering and marked the land uses they observed on 6-inch-to-the-mile Ordnance Survey maps. The completed sheets vary widely in their appearance, as volunteers differed in their enthusiasm for the project and the amount of time they had available to devote to it. Some are clearly and neatly labelled and coloured, with extensive additional notes, some are more restrained and functional, with little or no use of colour and few annotations; others are downright messy, clearly completed in a hurry, in the field. Irrespective of their quality, when the maps arrived at head office, they were stamped with the date of receipt and then photographed.
Stamp estimated that there were about 20,000 sheets to cover, with each sheet taking two to three days to complete. Field surveying started in October 1930, but most of the work was done between 1931 and 1934. During this period Stamp continued to tour the country extensively, meeting with local officials and offering encouragement to field workers. The Survey also issued regular bulletins to the volunteers to keep them informed on the progress of the project as a whole and to clarify questions or problems with the surveying.
By January 1932 some 400 sheets had been returned, and by January 1934 this had risen to over 15,000. The bulk of the fieldwork was finished by the end of 1935, with a flying squad of surveyors, mainly geography students or former geography students from London University, finishing off remoter areas that local volunteers could not cover. This stage of the project was clearly an enormous undertaking and by the end Stamp estimated that it had involved about a quarter of a million school children, as well as teachers and other adults.
Publishing – and paying for – the Survey
By 1935 the emphasis of the Survey had switched to publication. The time and expense involved in publishing a full set of maps at the six-inch scale would have been prohibitive, so the original maps were reduced and edited for printing as one-inch-to-the-mile maps. These still took eight weeks of editing work. Most of this was done by what Stamp described as “girls with a good school record including geography”, who had been specially trained for the job. Edited maps were then checked in the field to ensure accuracy by London University geography students and other volunteers.
The Survey also began to prepare for publication a series of county reports. The authors were not paid, and often even contributed to the cost of production. Each report included an overview of the Survey’s findings for that county, looking at patterns of land use, environmental and economic conditions.
The Survey’s finances were always precarious. LSE provided free office space and an initial grant from the Rockefeller Foundation. The fieldwork was done on a shoestring, with education authorities often buying their own maps, and all the surveying work done by volunteers. But the publication process was extremely expensive.
By September 1934, the Survey had only published a few maps, but it had already run out of funds. In early 1935, Stamp secured a grant from the Pilgrim Trust and publication work resumed. But when this money ran out in summer 1936, Stamp was forced to sign an agreement accepting personal responsibility for the Survey’s finances. He then organised the Survey as a wholly-owned subsidiary of a small private publishing company, Geographical Publications, and used the profits from the sale of his own books published by the company to meet the Survey’s losses. Some local authorities and other patrons made contributions – for example by financing the publication of the maps for their area. But funding continued to be a struggle and Stamp wrote afterwards that the hardest thing about the Survey was managing the money.
The Survey never employed more than 12 paid staff. Its total cost was around £53,000, but Stamp estimated that if the work had been carried out at market cost, it would have been four times that.
The impact of the Second World War
In the end, it was the outbreak of the Second World War that secured the project’s successful completion, as the data became crucial to the government’s drive to maximise domestic food production. More than 8,000 six-inch-to-the-mile sheets were loaned back to local War Agricultural Executive Committees to help them identify areas of land which could be cultivated.
In other ways the War made the Survey’s work more difficult. It lost its head office premises in 1939 when LSE evacuated to Cambridge and its site was taken over by government offices. For a while the Survey was able to work from the offices of its printers, GW Bacon and Co Ltd, but in 1941 these were bombed in an air raid. This not only destroyed office records and stocks of printed maps, but also delayed printing operations. The Ministry of Agriculture finally provided office accommodation in 1943.
The Land of Britain: its use and misuse
1944 to 1946 saw the publication of the final maps and county reports. These were followed shortly after in 1948 by Stamp’s final overview of the Survey’s findings, The Land of Britain: its use and misuse. In 1949 Stamp was awarded the Royal Geographical Society’s founder’s medal for his work.
Following the completion of the Survey in the 1940s the maps were initially stored in LSE’s Department of Geography, before being transferred to LSE Library in the 1970s. We have about 15,000 sheets, some of which are the original hand-coloured ones completed by the field workers; others are the Survey’s black and white photographs of the original maps.
Although Stamp was not the first person to employ land use survey methods in Britain, he was the first person to organise and complete such a survey at the national scale. And his achievement is all the more outstanding as such a large proportion of the work was done by voluntary effort.
Town and country planning in post-war Britain
The Survey proved its practical value very quickly, in helping to plan and organise the increase in domestic food production during the War. Stamp and his Survey also had a significant impact on town and country planning in post-war Britain. His basic principle was that land should be used as productively as possible and that agriculture, housing, industry, leisure and transport were actively developed in an organised and balanced way. He proposed that in post-war Britain:
- The best land – making up approximately 38 per cent of the total surface of the country – should be reserved for agricultural use except in exceptional circumstances.
- Housing, industry and transport should be developed on land of intermediate quality.
- Schemes requiring extensive tracts of land – for example national parks, green belts, motorways and water and power supply systems – should be restricted to poor lands.
Stamp served as vice chairman of the Scott committee on land utilisation in rural areas from 1941 to 1942 and as chief adviser on rural land utilisation in the Ministry of Agriculture from 1942 to 1955. His later service as a member of the royal commission on common land, as a member of the Nature Conservancy, and as chairman of the national resources advisory committee of the Ministry of Land and Natural Resources continued his influence. Stamp also wrote widely on problems of population growth, food, resources, and the environment. The success of the Survey also led him to develop a scheme for a world land use survey and maps and memoirs of a number of countries were published under his direction.
As Stamp himself anticipated, the maps from the Survey are proving an interesting and valuable historical resource. They are interesting to look at in their own right, presenting a snapshot of the landscape at a particular point in time. But the maps can also be used in comparison with other sources, as a starting point for a historical analysis of the way our countryside has changed over time. Other sources on land use are harder to find, but government reports and statistics, enclosure maps, estate maps and tithe maps and their accompanying schedules, can all help us piece together a picture of land use through the ages.
“The modern Domesday Book” is featured in the LSE Festival 2023 exhibition, Mapping people and change.