
LSE London is proud to introduce new contributions from partner authors. The views and opinions expressed in this blog are those of the authors.
As the UK’s biggest and most-globally connected city, London emerged as an early hotspot for cases in the novel coronavirus (covid-19) epidemic. Four months into the outbreak, is it now possible to draw out some early observations about the trajectory of cases and deaths in and across the city. In this blog, I explore the available data about the coronavirus outbreak in London and how some demographic and socioeconomic factors may be affecting variations in case and death rates.
Though there are many data-related challenges to studying covid-19, it is important to find out what we can about localised impacts of the disease. Learning about how the pandemic effects different communities can improve strategies for prevention. It also helps us better understand the health impacts of deprivation and inequality in the city, as an emerging body of evidence suggests that conditions relating to deprivation and discrimination may impact both case spread and mortality.
The big picture: how many cases and deaths have been recorded in London?
Information about deaths and cases is available from multiple official sources. The government’s coronavirus data dashboard compiles available data about the number of lab-confirmed cases, aggregated down to the local authority level (for London, this is each borough). The ‘location’ of a case corresponds to the home postcode of the person testing positive for covid-19.[i] The question of exactly how many coronavirus cases exist has dogged scientists since the start of the outbreak. There remains lingering concern about under-testing and a lack of consensus about how many asymptomatic (therefore unknown) cases there are.[ii] It is also important to mention that in the last few days, there have been new controversies around case reporting relating to tests conducted by commercial labs (as opposed to NHS hospitals and PHE labs).[iii] It appears that these results are not included in sub-national case counts,[iv] but it is also difficult to find out where ‘commercial partners’ are running tests. This is all noted to suggest that, while case numbers are offered here because they are what is publicly available, readers should treat them carefully.
Multiple sources offer information about deaths, including the National Health Service (NHS), Office of National Statistics (ONS), and the Quality Care Commission (QCC), all of which vary on completeness, timing, and location of deaths.[v] In this analysis I rely on death datasets produced by the Greater London Authority’s online datastore, which collects statistics for Greater London. The datastore has created several death-related datasets pulling from the above primary sources, including deaths by week aggregated by place of death (home, care home, hospital).
With those caveats it is possible to delve into the numbers to understand the picture of coronavirus in London. Figure 1 shows daily reported new cases for Greater London. It illustrates that, as far as lab-confirmed, hospital-based case reporting is concerned, new cases are down significantly from their 2nd April peak, where 1022 new cases were reported in a single day.[vi]

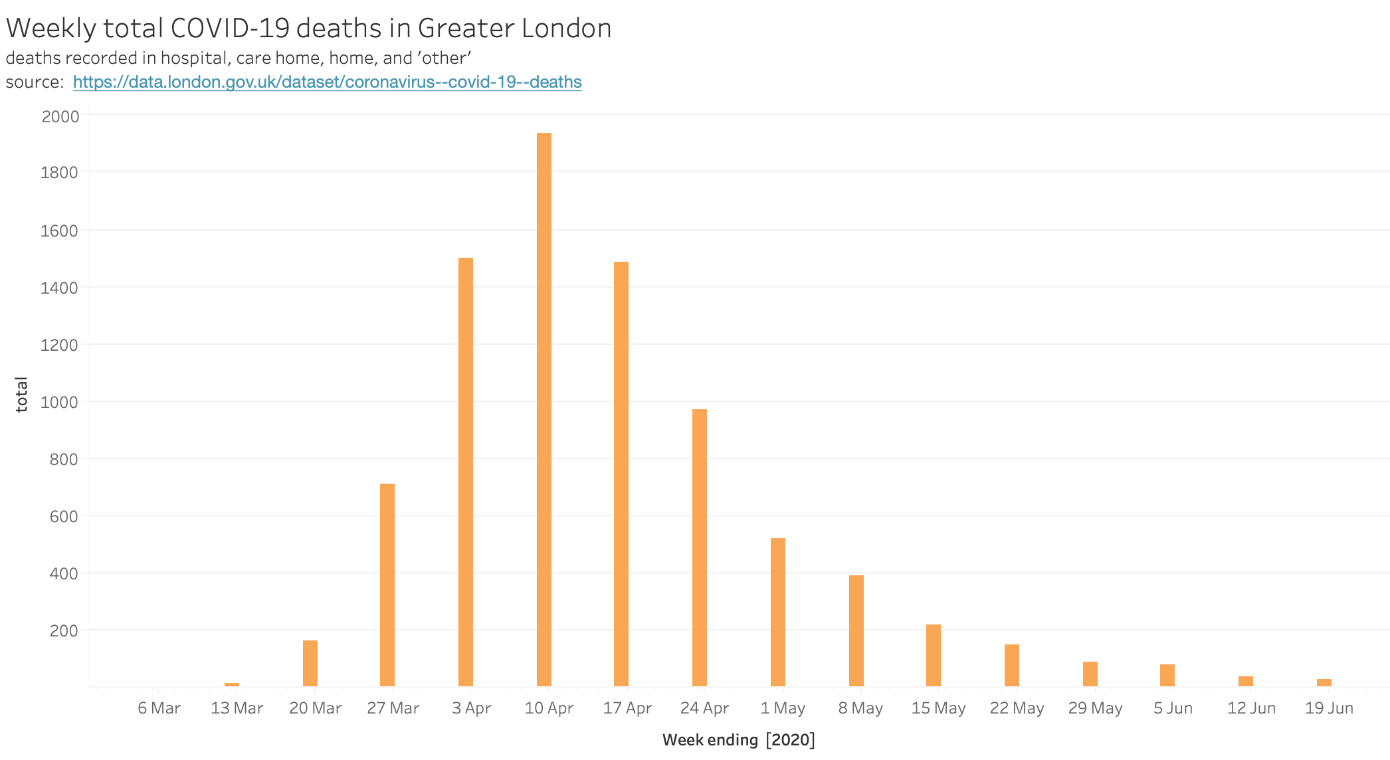
A complete account of deaths (one that includes those dying of Covid-19 in hospitals, care homes, and ‘other’), is available in weeklong increments[vii] and shown in Figure 2. Unsurprisingly, the pattern mirrors that of case reporting. Deaths peaked in the week of 4 April, with 1,937 reported across locations.
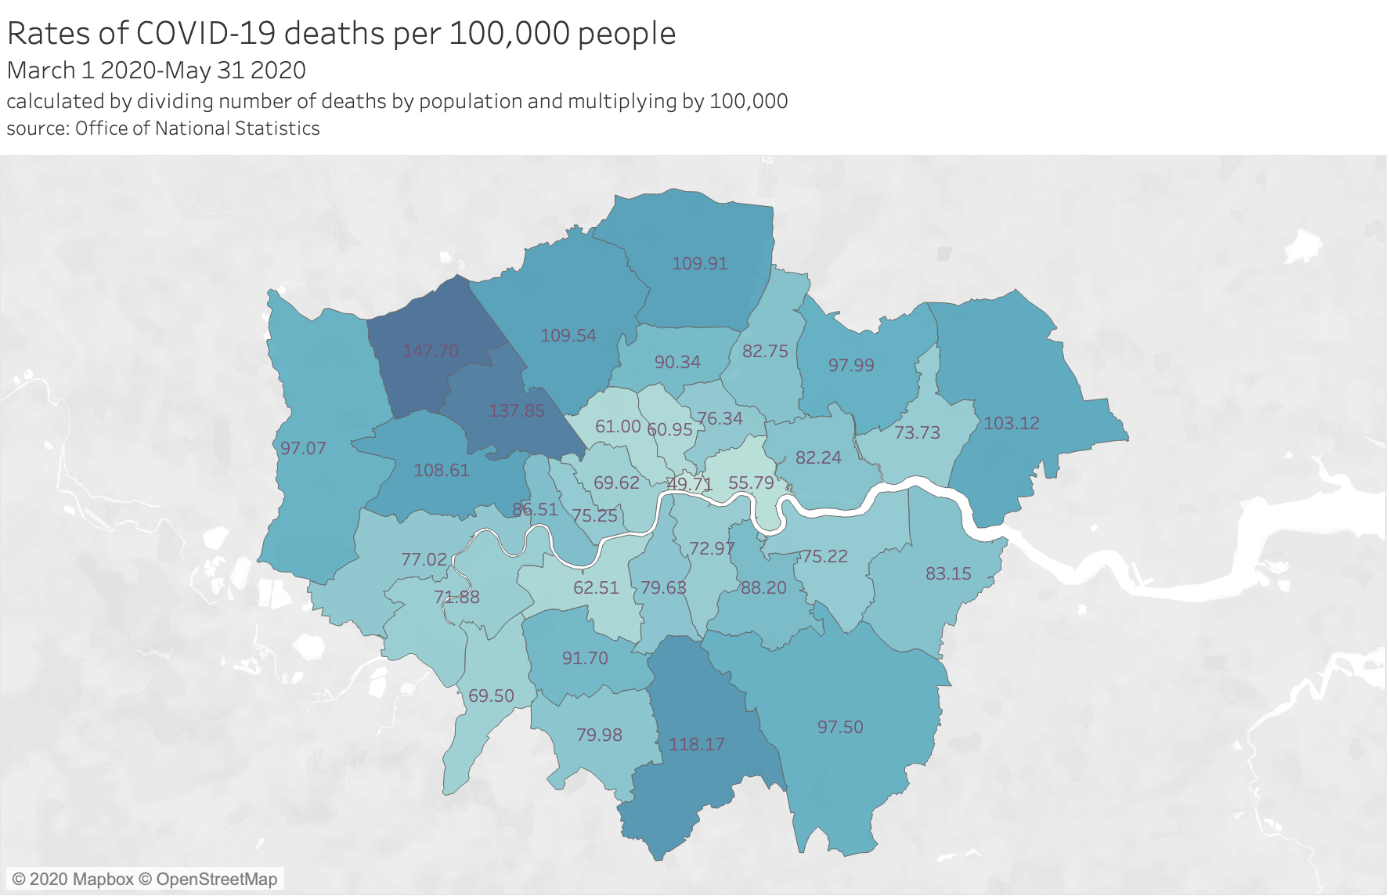
Looking at London in comparison with the rest of the UK, analysis from the ONS shows that, between March and May, ‘London had the highest age-standardised mortality rate with 137.6 deaths involving COVID-19 per 100,000 persons; this was statistically significantly higher than any other region in England and more than a third higher than the region with the next highest rate.’[viii] However, they also note that from May onwards, London has experienced lower mortality rates than the rest of the country. New ‘peaks’ of cases have since developed in other UK regions, including Leicester where cases have risen so far as to require a roll-back of lockdown easing. Media coverage of mild new increases in hospitalisations in some London boroughs[ix] may be a cause for concern in the near future, especially as more lockdown restrictions are set to ease on July 4th.
Borough-level analysis
Looking beyond the overall picture, we can compare case rates across London boroughs. Figures 3 and 4 show the rates of coronavirus cases per 100,000 people for each London borough, and death rates per 100,000 people respectively. Case rates are up to date through to 24 June. Geographically-identified deaths are released with more delay by the ONS and are therefore up to date only up to 31 May.

What drives variation in case and death rates?
One thing that the by-borough breakdown shows is that there are differences in how strongly coronavirus impacts different communities. The most important indicators of covid-19 mortality risk are age and pre-existing health conditions.[x] As these variables are well understood already, I instead examine other demographic and socioeconomic factors that can affect variations in case and death rates.
The disporpotionate impact on BAME groups
One of the most-discussed questions about the coronavirus outbreak in multiple countries has been around its disproportionate impact on BAME (Black and Minority Ethnic) groups. Fairly early in the UK outbreak, it was noted that more BAME people were hospitalised and dying of covid-19 than their share of the population. A discussion of the impact of Covid-19 on BAME populations is highly relevant for London because ethnic minorities make up 40.2% of the city’s population, the highest rate among all authorities in England and Wales.[xi]
A report from Public Health England (PHE) was released on June 2nd[xii], looking at dispiarities in risk and outcomes for covid-19 for a number of demographic classifications. The report confirmed that BAME groups were hit harder by the virus in various ways. Among other findings, the PHE report concluded that ‘people of Chinese, Indian, Pakistani, Other Asian, Caribbean and Other Black ethnicity had between a 10% and 50% higher risk of death when compared to White British’ when controlling for sex, age, and region. In addition, Black ethnic groups had the highest standardised diagnosis rates.
A research briefing from the Greater London Authority[xiii] notes that understanding what drives the link between ethnicity and covid-19 outcomes is complicated by many factors “including our relative lack of knowledge regarding…a novel disease, the difficulty….of obtaining reliable data on patients’ ethnicity,…the socially constructed nature of ethnicity itself, and the high degree of association between many of the potential causal factors which might be implicated”. In other words, the link between ethnic background and covid-19 mortality is related to existing structural health inequalities, legacies of racial discrimination, and overlaps with other risk factors like deprivation.[xiv]
Occupation is another likely impactful factor. Research from Institute for Fiscal Studies[xv], profiled by LSE, also points to key worker status as a risk factor – the high rates ef ethnic minorities in jobs in like health, social care, and transport, industries in which some workers have strugged to prevent virus exposure is particularly relevant.[xvi]
Returning to by-borough analysis, we can compare by-borough death rates per 100,000 people (which are likely to be the most accurate statistic avaliable given the unreliability of case rate data) with the proportion of BAME people in the population.[xvii] Figure 5 shows a weak positive correlation (r2 = .11) between deaths from covid-19 in London boroughs and proportions of BAME people in the population. This correlation supports the aforementioned findings that there is some relationship between ethnicity and covid-19 impact. However, the weakness of the relationship also suggests that, as other researchers have already suggested, that ‘vulnerability’ to the disease is caused by the confluence of different risk factors.[xviii]

Housing and poverty
Housing quality and overcrowding are another set of related factors that may drive variation in case rates across the city. Poor housing has always had impacts on public health[xix] – and there is some initial research exploring the links between overcrowded homes and covid-19. London remains one of the England’s worst cities for overcrowding and homelessness, a fact that has unfortunately persisted and worsened since the 1990s.[xx]
A report from Inside Housing[xxi] demonstrated an initial positive correlation between death rates and overcrowding by comparing covid-19 mortality rates for UK local authorities from 1 March to 17 April with overcrowding data from the 2011 census. London boroughs like Newham, Brent, and Tower Hamlets have some of the highest rates of overcrowded homes in the country, as well as high rates of covid-19 mortality. Other factors that correlate positively in this analysis with covid-19 mortality are the rates of people in temporary accommodation and the numbers of households on waiting lists for social housing.
Another project from the Social Market Foundation and the University of Essex from April[xxii] delves into what exactly it is about overcrowded and poor quality houses that increases covid-19 risk. This analysis cites not only the obvious difficulties in self-isolating, but also the negative health effects caused by long-term exposure to cold and damp. In communities where over-crowded housing intersects with high rates of intergenerational accommodation[xxiii], this risk may be compounded. Statistical modelling from the New Policy Institute confirmed that there may be a link between intergenerational co-living and the covid-19 caseload.[xxiv]
Readers interested in comparing covid-19 deaths against other variables like housing quality and deprivation can visit the GLA Datastore website, which has recently released a useful mapping tool for this exact purpose. The tool takes advantage of the fact that death rates are also available at the Middle Super Output Area level (a smaller geographical area than a borough), allowing for finer-grained geographical analysis.
Looking forward
As far as recorded deaths and cases go, Greater London has come a long way since March and April when it was the first epicenter of the UK outbreak. The NHS’s Nightingale hospital, built at record speed in London’s docklands, officially closed on May 19th. Businesses are being allowed to re-open and there is at least some sense that things are slowly inching back to normalcy.
Moreoever, anyone who has been out in recent days has probably observed that compliance with strict lockdown measures has waned. Weekend protests in June also drew large numbers into central London. For now, it is too soon to tell whether these factors and the gradual relaxation of lockdown measures by the government will affect case rates at all. As the recent explosion of cases in the United States suggests, it is necessary to monitor case rates closely to avoid a rebound.
In exploring drivers of variation in case rates and deaths from covid-19, I have also highlighted that the coronavirus outbreak has signifigant implications for inequalities that exist in London. Many of the problems the city was already facing – low quality rental housing, racial inequality, and high rates of people in insecure work – both likely made the impact of the virus worse and will make it harder to recover. Future policy responses must include not only a more effective virus response that recognises the needs of high risk groups, but also stronger social protections for the long term.
The extent of the coronavirus outbreak in Brent, which has the highest age-standardised mortality rate of in England and Wales, was recently covered by the Guardian. This searing account of the impact of the virus on a small British-Somali enclave in the borough reminds us that behind the numbers we analyse, there are real communities who have lost so much.
[i] Gov.uk (2020) Coronavirus (COVID-19) in the UK. [online]. Available from: https://coronavirus.data.gov.uk/about [Accessed June 25, 2020].
[ii] London Datastore (2020) Coronavirus (COVID-19) Deaths – London Datastore. [online]. Available from: https://data.london.gov.uk/dataset/coronavirus–covid-19–deaths [Accessed June 25, 2020].
Mizumoto, K., Kagaya, K., Zarebski, A., Chowell, G. (2020) Estimating the asymptomatic proportion of coronavirus disease 2019 (COVID-19) cases on board the Diamond Princess cruise ship, Yokohama, Japan, 2020. Eurosurveillance. 25(10).
[iii] Neville, S., Hughes, L., Burn-Murdoch, J., Bounds, A. (2020) Lack of local Covid-19 testing data hinders UK’s outbreak response. The Financial Times [online]. Available from: https://www.ft.com/content/301c847c-a317-4950-a75b-8e66933d423a [Accessed July 2, 2020].
[iv] Gov.uk (2020) Coronavirus (COVID-19) in the UK.
[v] NHS England (2020) COVID-19 Daily Deaths. [online]. Available from: https://www.england.nhs.uk/statistics/statistical-work-areas/covid-19-daily-deaths/ [Accessed June 25, 2020].
Office for National Statistics (2020) Registrations and occurrences by local authority and health board. Office for National Statistics. [online]. Available from: https://www.ons.gov.uk/peoplepopulationandcommunity/healthandsocialcare/causesofdeath/datasets/deathregistrationsandoccurrencesbylocalauthorityandhealthboard [Accessed June 25, 2020].
[vi] Testing capacity has increased over time – it is likely that there were more cases than were recorded in the early stages of the outbreak when testing was less available.
[vii] This is done in part because there are usually delays of several days for reporting of death rates.
[viii] Office for National Statistics (2020) Deaths involving COVID-19 by local area and socioeconomic deprivation – Office for National Statistics. [online]. Available from: https://www.ons.gov.uk/peoplepopulationandcommunity/birthsdeathsandmarriages/deaths/bulletins/deathsinvolvingcovid19bylocalareasanddeprivation/latest [Accessed June 25, 2020].
[ix] Harris, S. (2020) London local lockdowns? Council leaders play down speculation. ITV News. [online]. Available from: https://www.itv.com/news/london/2020-06-30/london-local-lockdowns-council-leaders-play-down-speculation-as-some-hospitals-see-covid-19-cases-rise [Accessed July 2, 2020].
[x] Raleigh, V. (2020) Deaths from Covid-19 (coronavirus). The King’s Fund.
[xi] Gov.uk (2019) Regional ethnic diversity. [online]. Available from: https://www.ethnicity-facts-figures.service.gov.uk/uk-population-by-ethnicity/national-and-regional-populations/regional-ethnic-diversity/latest [Accessed June 25, 2020].
[xii] Public Health England (2020) Disparities in the risk and outcomes of COVID-19, [online] Available at: https://assets.publishing.service.gov.uk/government/uploads/system/uploads/attachment_data/file/892085/disparities_review.pdf
[xiii] Greater London Authority (2020) The demographic impact of covid-19 in London. GLA City Intelligence Briefing [online] Available from: https://data.london.gov.uk/dataset/briefing–demographic-impact-of-covid-19
[xiv] Abbs, I., Bibby, J., Everest, C., (2020) Will COVID-19 be a watershed moment for health inequalities? The Health Foundation. [online] Available from: https://www.health.org.uk/publications/long-reads/will-covid-19-be-a-watershed-moment-for-health-inequalities
[xv] Platt, L., Warwick, R. (2020) Are some ethnic groups more vulnerable to COVID-19 than others? Institute for Fiscal Studies. [online]. Available from: https://www.ifs.org.uk/publications/14827 [Accessed June 25, 2020].
[xvi] Marsh, S., McIntyre, N. (2020) ‘Six in 10 UK health workers killed by Covid-19 are BAME’ The Guardian, 25 May 2020. [online]. Available from: https://www.theguardian.com/world/2020/may/25/six-in-10-uk-health-workers-killed-by-covid-19-are-bame [Accessed June 25, 2020].
[xvii] Ethnicity data from GLA datastore, death rates from GLA datastore
[xviii] Greater London Authority, The demographic impact of covid-19 in London.
[xix] Nicol, S., Roys, M., Garrett, H. (2016) The cost of poor housing to the NHS. BRE Trust.
[xx] Barton, C. and Wilson, W. (2020) Briefing paper: overcrowded housing (England). House of Commons Library Briefing number 1013.
[xxi] Barker, N. (2020) The housing pandemic: four graphs showing the link between COVID-19 deaths and the housing crisis. Inside Housing, 29 May 2020. [online]. Available from: https://www.insidehousing.co.uk/insight/insight/the-housing-pandemic-four-graphs-showing-the-link-between-covid-19-deaths-and-the-housing-crisis-66562 [Accessed June 25, 2020].
[xxii] Clair, A. (2020) Homes, health, and COVID-19: how poor housing adds to the hardship of the coronavirus crisis. Social Market Foundation, 2 April 2020.
[xxiii] BBC (2020) Isolating ‘difficult’ in multi-generational home. BBC News, 1 April 2020. [online] available at: https://www.bbc.co.uk/news/uk-england-leeds-52117636
[xxiv] Holden, J. and Kenway, P. (2020) Accounting for the Variation in the Confirmed Covid-19 Caseload across England: An analysis of the role of multi-generation households, London and time. New Policy Institute.


Really interesting collation of what we know – and what we don’t know. Interested in the extent to which the public transport system contributes to transmission of the virus, given differing views – from Mayor Khan proclaiming that the system was safe to use, early on in the pandemic, to current widespread fear of using the tube – and limited research on how dangerous using the tube actually is.
Will be interesting to see how the curtain twitchers react to these changes. Can’t lie, I’ve been hella cautious this whole time and not been cool with people having BBQs and picnics, but now as long I protect myself as much as possible people can do what they want.
Молодець, Саломе!