In a recent Guardian article, Simon Jenkins suggested that voter decisions regarding the EU referendum will be made on the basis of gut instinct alone, and that personal characteristics and previous party support provide no guide. Using a new modelling strategy applied to a large body of YouGov opinion poll data, Ron Johnston, Kelvyn Jones and David Manley address Jenkins’ claim, and find it wanting. The young and the well-qualified appear much more inclined to Remain than the elderly, and voting intentions to Leave seem to match, not surprisingly, support for UKIP.
The British – and to a lesser extent the European, even the world – media is currently obsessed with the UK referendum on membership of the European Union. Amongst all the speculation is much interpretation of a welter of opinion polls to gauge its likely outcome. Who is in favour of staying in, who is against – where do those separate groups live – what is the likelihood of them actually voting on the day and influencing the outcome?
Among many recent attempts to address those questions was a Guardian article by distinguished commentator Simon Jenkins, entitled ‘On Brexit, gender, age and political party are no guide as to how we’ll vote’. This headline was undoubtedly (at least partly, and far from atypically) copy-editor hyperbole. Jenkins’ core argument is that in the absence of ‘facts’ to sustain decision-making on how to vote – because the debate is ‘over what is inherently unknown’ – people are making their minds up on their gut instincts based on ‘hard-wired emotions’ and how we ‘feel about ourselves’.
So is it impossible to predict the outcome based on the usual psephological techniques – using opinion poll data to identify the groups likely to vote either yes or no? Some early results from modelling work we are doing with YouGov to predict the outcome across the local authorities in which the votes will be counted is identifying some very clear patterns. Research on the 2015 general election showed that the three major determinants of how people voted then were age, sex, and educational qualifications, and they have been used as the basis for our current research.
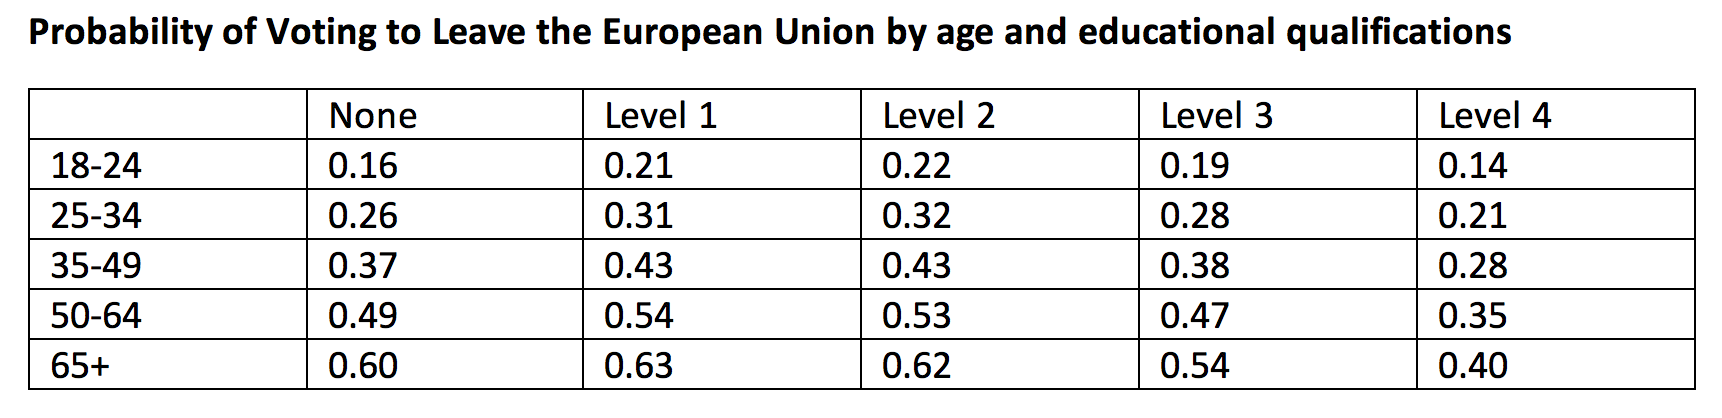
Using a large body of YouGov polling data collected during 2015 and the first quarter of 2016 – some 60,000 responses in all – the table shows our modelled probabilities of individuals in each of five age groups and five educational qualification levels either certain or leaning towards a vote for Brexit. The five qualifications levels range from those with none at all, through Level 1 – GCSE and its equivalents – to Level 4 – a degree or equivalent.
There is a very clear pattern. At every qualification level, the older the respondents the greater the probability that they will vote for Brexit (see the table below, a score of 1 would mean absolute certainty to vote Leave). Indeed, the differences between the age groups are substantial, with on average about a threefold difference between the youngest and the oldest in the probability that they will vote for the UK to leave the EU – though the difference is greater among those with no qualifications than among those with degrees. (Overall, only just over one-in-three favour Brexit, a much larger difference – that didn’t change significantly over the 15-month period – than other polls, using different methodologies, are reporting. As we are interested at this stage in the relative support for Brexit across the groups rather than the absolute support, that difference is not of great importance.)
There are also substantial differences – especially among the middle-aged and the old – in their declared propensity to vote for Brexit according to their qualifications. Older people with degrees are only two-thirds as likely to vote to Leave the EU as older people with no qualifications, whereas among younger voters there is only a small difference. The young, whatever their age, are very largely against Brexit; among the old, the intensity of their anti-EU sentiment varies substantially according to their qualifications.
Census data are available showing qualifications by age group for each local authority (the areas that will be used for counting and reporting the referendum result). Using these and the table we have modelled the estimated probability of each local authority’s electorate voting for Brexit in the June referendum. We also know, for each of those areas, the proportion of their voters at the 2014 European Parliament elections who supported UKIP – the only major political party committed to Brexit.
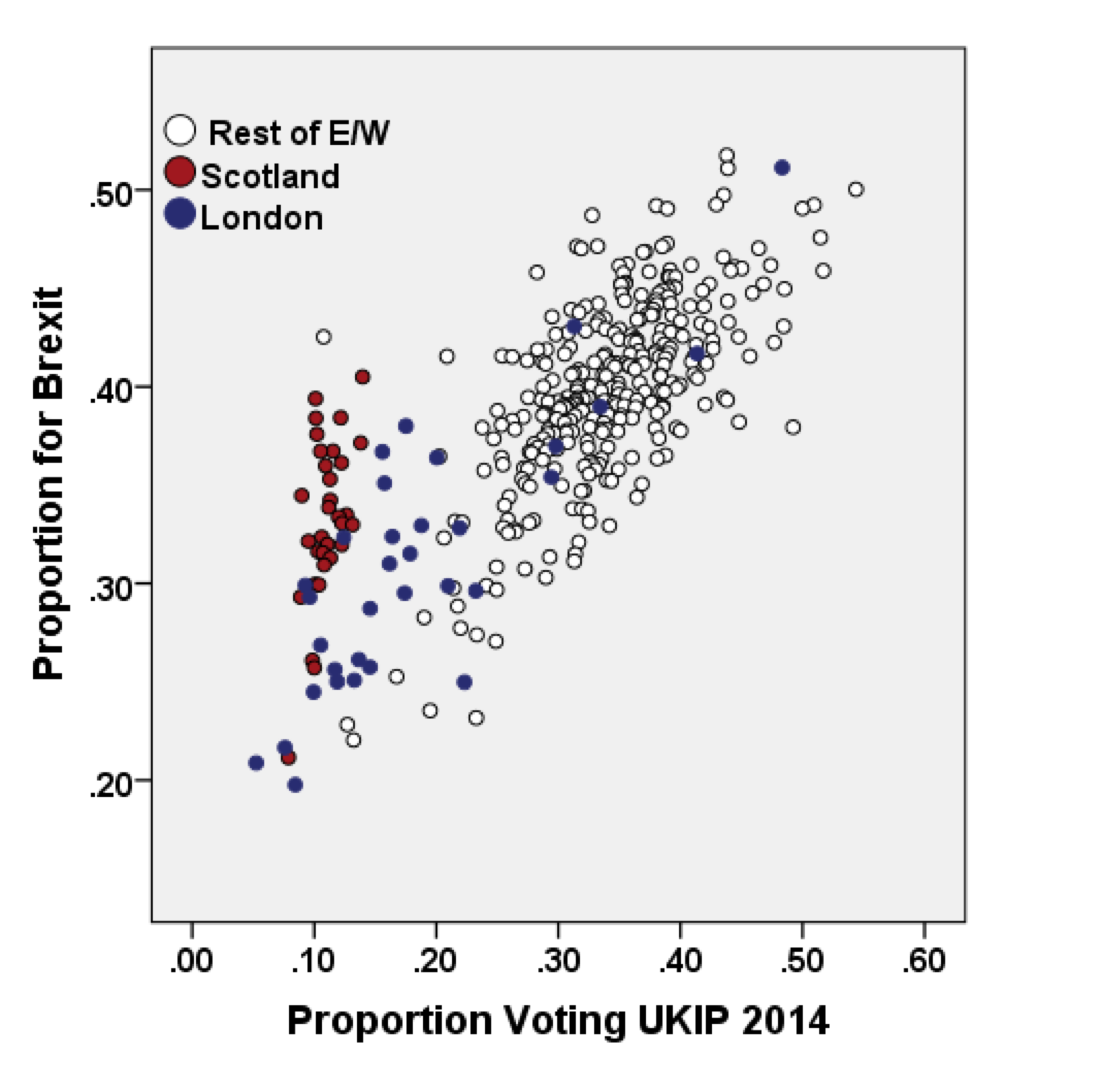
The graph shows a very clear relationship between the two proportions: the more people in an area who voted UKIP in 2014 the more – surely unsurprisingly – who favour Brexit now: the two groups, undoubtedly many of them the same people, live in the same places. (For those interested in the technical detail, the correlation between the two is 0.75.) Local authorities in two regions that stand out from the rest with very low support – for both UKIP in 2014 and Brexit in 2016 – are separately identified; most of the London boroughs and most Scottish local authorities differ substantially from the rest of Great Britain.
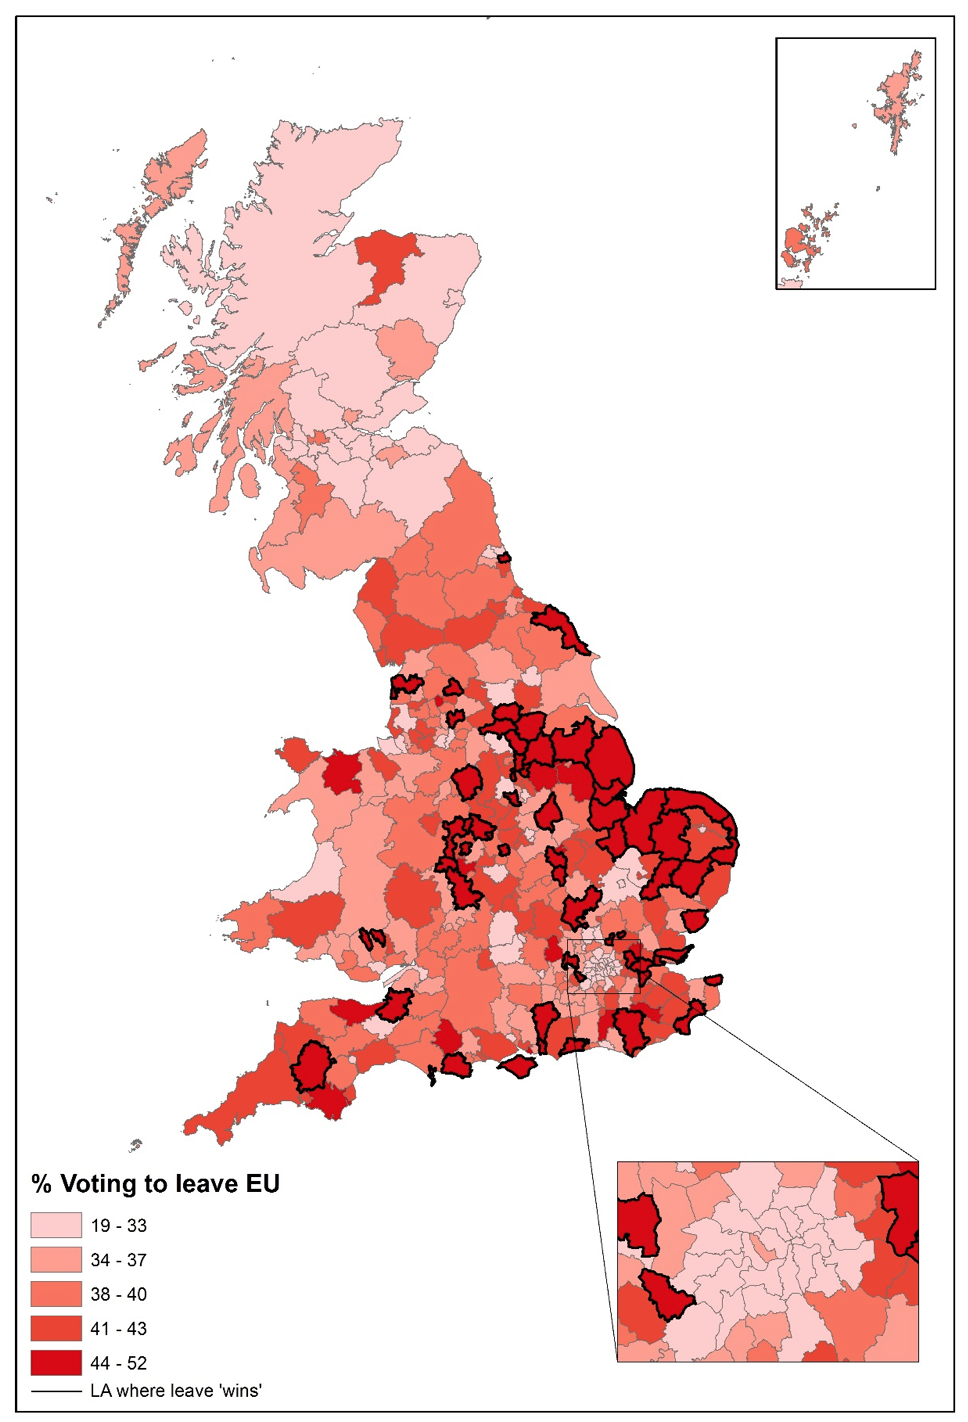
Where are those places, where is Brexit most popular and unpopular? South Staffordshire has the highest proportion favouring departure from the EU, according to the age and qualifications profile of its population, followed by Havering, Gravesham, Boston, Kings Lynn, Mansfield, and Tendring (which includes Clacton). The areas giving least support to Brexit are Lambeth, Hackney, Edinburgh, Haringey, Oxford, Cambridge, Bristol and Brighton – in general, places with fewer old people than the first group and many more graduates.
Our map of the percentage support for Brexit according to this model shows some very clear geographical patterning. At one extreme are the two clusters of local authorities where support for leaving the EU is very low – in almost all of London (the boroughs are shown in the inset) and most of Scotland. Against this, the areas with most support for Brexit – the darker shading – are concentrated along much of England’s east coast plus some of the older industrial areas (notably in Yorkshire and the West Midlands), with pockets along the south coast too (mainly local authorities with large retired populations).
These first results from our modelling of the geography of support for Brexit give the lie to Simon Jenkins’ headline writer: we have estimated that geography by combining polling and census data, generating a pattern very similar to that for voting UKIP at the 2014 European Parliament elections. Of course, the ultimate test of our models – which we will be developing further – will be on 24 June: have we got the geography right; are our predicted areas of strength and weakness of the Brexit cause correct? Much will depend on other factors not yet incorporated in the models – especially turnout rates: will the young, who are much more favourably inclined towards the EU, turn out in the same numbers as the old, who are much more against continued membership? Only time will tell. In terms of knowing who will support Brexit and where, however, we are much less pessimistic than Simon Jenkins and his copy-editor – the data are quite strongly patterned by people and place.
__
Note: The authors are grateful to Joe Twyman and Anthony Wells of YouGov for facilitating this experiment in modelling voting outcomes by providing the polling data. More details on the modeling procedure can be obtained from the authors: R.Johnston@bristol.ac.uk
 Ron Johnston is Professor in the School of Geographical Sciences at the University of Bristol
 Kelvyn Jones is Professor in the School of Geographical Sciences at the University of Bristol
 David Manley is a senior lecturer in the School of Geographical Sciences at the University of Bristol.
(Featured image: Geograph CC BY-SA 2.0)


There will be a built-in statistical bias to non-graduates preferring Brexit because only the top 5% of students went to University before Blair’s government introduced the “50% of all school leavers should go to University” target.
Therefore any region with a high proportion of middle-aged or older (who generally favour Brexit as they are more aware of the history and what has already been surrendered) will tend to be largely non-graduates.
No we can’t