 One of the most important functions of a government is to ensure the health of its population, with the main indicator being measures of mortality such as life expectancy. Mike Murphy writes that, contrary to popular belief, current levels of mortality are the lowest ever recorded by a substantial margin.
Recent reports of adverse mortality trends in Britain have attracted considerable media, academic, and political attention. The headline statement that life expectancy has fallen by six months has been widely disseminated: it was quoted in Parliament by the Leader of the Opposition, and in the valedictory report by the past-President of the Public Health Faculty in July 2019. If true, this was a major event – annual life expectancy at birth in Britain had never declined by such an amount since 1951.
In fact, the figure referred to a revision of forecasts by the Institute and Faculty of Actuaries of life expectancy of those now aged 65. Since about half of these people are likely to be alive around age 90 in a quarter of a century’s time, this figure will be determined by what happens over the next 40 years or so, especially in the latter part of that period.
The misinterpretation of such data had long been pointed out, but continues to be widely disseminated. The British Medical Journal has already published a number of items this year asserting that mortality is deteriorating or at best stalling, however none of these include the most recent data available.
Measuring trends in mortality
The most widely-cited source for life expectancy figures is the Office for National Statistics (ONS). Unlike other countries, UK presents life expectancy as three-year averages rather than as single-year estimates, to smooth out annual fluctuations largely arising from seasonal variations in diseases such as influenza. The release in September 2018 attracted wide attention, since it reported that life expectancy had stopped improving for the first time since the current series was started in 1980-2. The conclusion was based on the fact that there had been no change between the latest average for years 2015-17 and the previous one over the period 2014-16 (i.e. simply one third of the difference between the annual values for 2014 and 2017, so some years out-of-date).
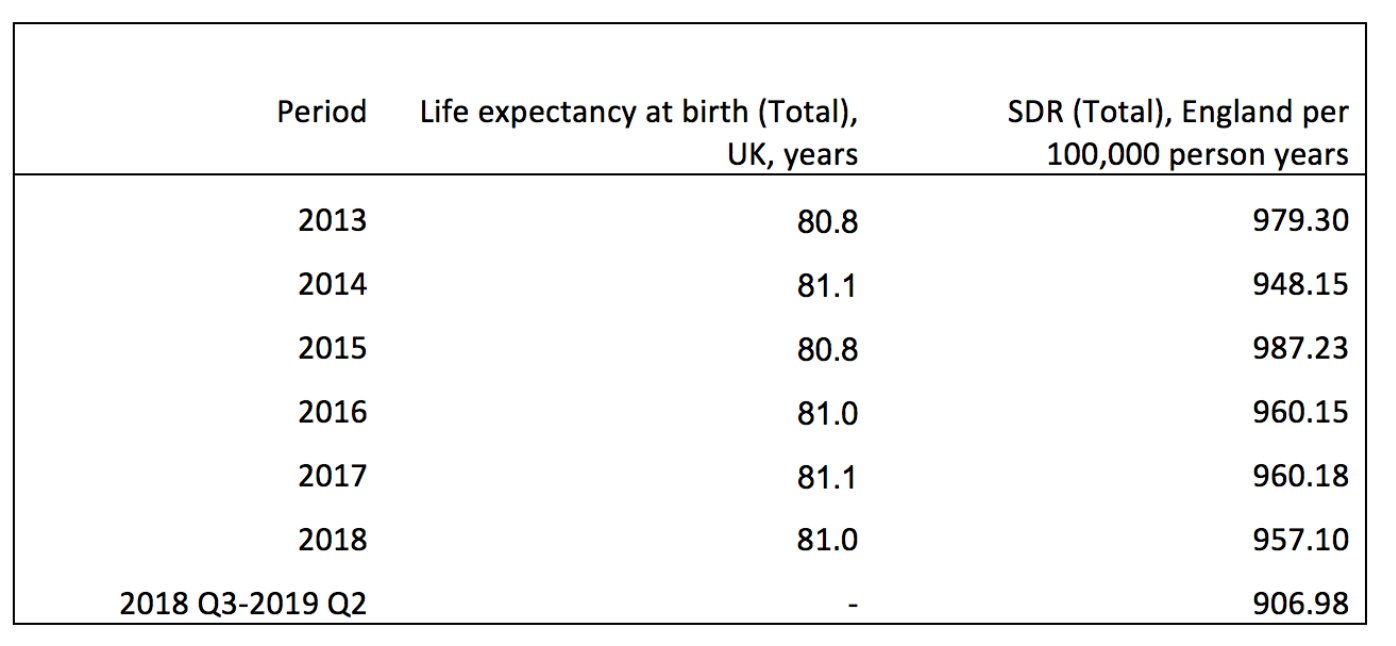
So, although life expectancy is the most widely cited indicator for this claim, it provides estimates of change that are some years out of date. Indicators such as Standardised Death Rates (SDR) are alternative valid measures of overall age-adjusted mortality, which – like life expectancy – are also wholly derived from age-specific mortality rates. However, SDRs are more timely, being published quarterly within three months of the end of the reference period, but only for England. Annual SDR values (necessary to control for seasonal variation) for England may therefore be computed up to the period July 2018 to June 2019 from published statistics (Table 1), although movements in other parts of great Britain tend to be very similar.
Table 1. Mortality indicators in Britain, 2013-19
 Sources: see here and here.
The role of winter fluctuations
The major determinant of year-to-year changes in mortality is fluctuations in the number of deaths in the winter months of the year. The number of excess winter deaths in England and Wales – the difference between the number of deaths that occurred between December and March and the average number in the preceding 4-month period (August to November) and the following April to July – was exceptionally low in 2014: the value for the winter of 2013-14 was, by a considerable margin, the lowest recorded in the series starting in 1950-51. Therefore, 2014 had a particularly high value for life expectancy at birth and changes computed from that baseline are correspondingly low (Table 1).
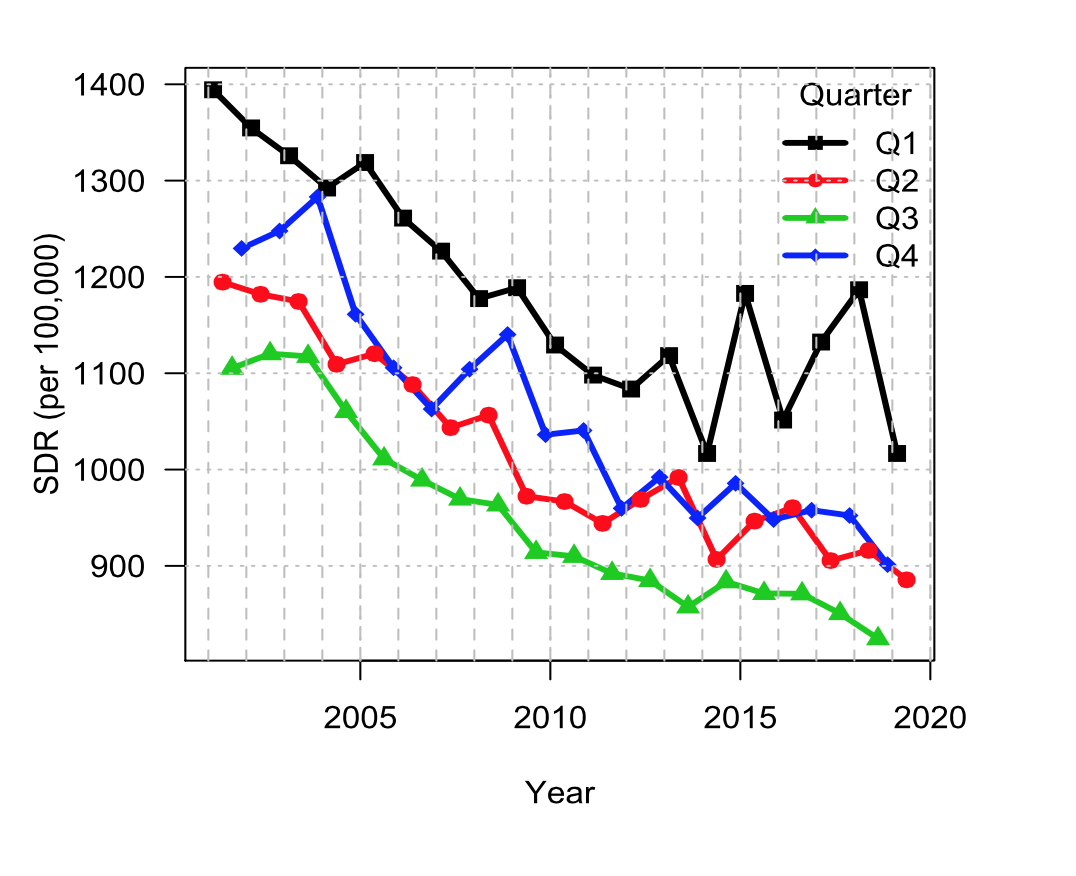
Figure 1 shows quarterly SDR values over this century. The stalling of the trend in mortality improvement around 2010 is apparent, although there is little evidence of actual deterioration apart from short-term temporary fluctuations largely concentrated in the winter period. Although the importance of winter mortality for year-to-year change is not disputed, the debate about the cause and implications of recent trends has become acrimonious, polarised and politicised. The main reason for increased variability on mortality has been identified as the impact of seasonal respiratory disease and the varying effectiveness of flu vaccines; yet this conclusion has been disputed, with government austerity policies identified as the major factor for mortality stalling.
Figure 1. Quarterly Standardised Death rates (SDR), England 2001-19.
 Source: see here.
The most common way of estimating winter effects is by comparing winter mortality indicators with the average of surrounding less-volatile non-winter values, as mentioned above. Estimates for England and Wales based on deaths are routinely published and we also present alternative estimates for England based on SDRs. Table 2 shows an SDR measure of excess winter mortality, the difference between the winter value for months January to March and the average of preceding and succeeding three non-winter months, for the periods just before and just after the start of mortality stalling. Average levels for the earlier period were larger than in the later one, but the percentage excess values are very similar, although this conclusion depends on the precise limits selected.
Table 2. Mean and standard deviation of winter excess SDR, England 2005-16
 Sources: see here and here. This compares the winter value as the SDR for January to March quarter with the average of the surrounding non-winter quarters of October to December and April to June as an absolute value and a percentage. A broader alternative measure based on October to March compared with preceding and succeeding values in the April to September period is also presented.
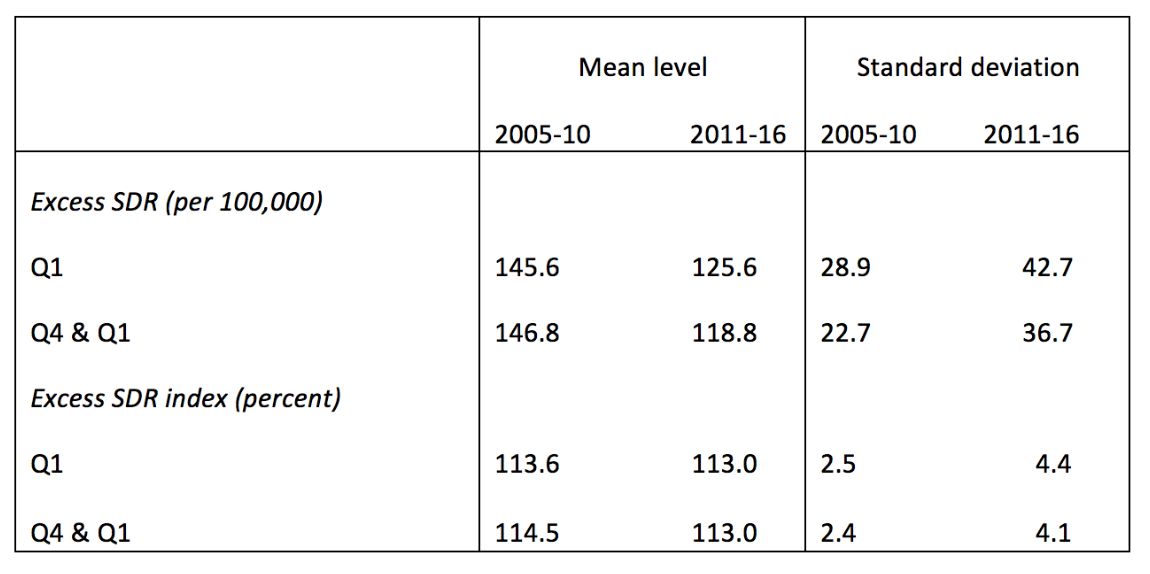
However, variability is considerably greater in the latter period, which contains both the highest and lowest values in England and Wales of Excess Winter Deaths in the period since 1976. A substantial increase in excess winter mortality levels would have been necessary for it to have a major impact on mortality stalling, but the magnitude of observed changes is insufficient to account for any but a small fraction of the secular reduction in mortality improvement since about 2010-11. Therefore, although clearly important for annual fluctuations around the trend, winter mortality/influenza has had a more limited impact on underlying trends than sometimes claimed, while making the identification of trends more difficult.
Recent trends in mortality
A striking feature of these recent results is that England has experienced rapid and unexpected overall mortality improvement in the last 12 months or so. Figure 2 shows actual 12-month annual values and a fitted smoothed underlying trend. Mortality is currently at an historic low level.
Figure 2. Annual 4-quarter SDR; original and trend values, England 2001-19
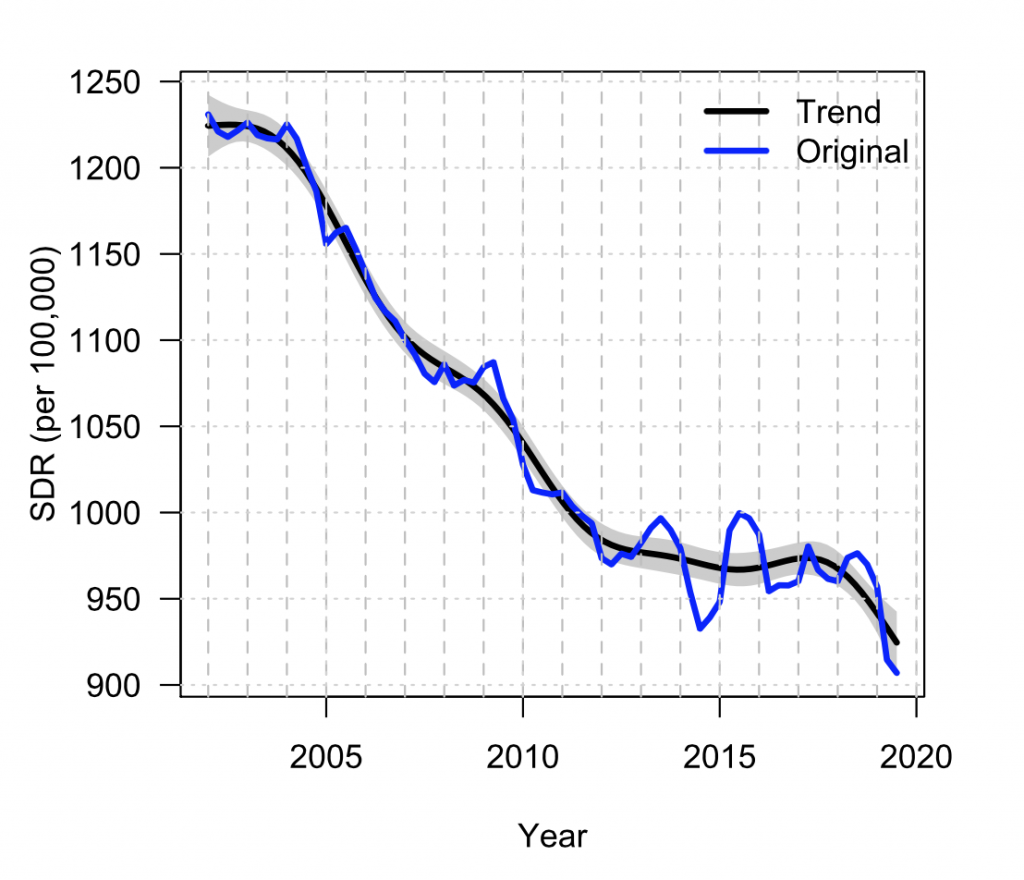 Source: see here. There are separate series published for each quarter. These were combined to produce a time series of 4-quarterly averages to remove seasonal variation. The smoothed trend values were obtained from a non-parametric generalised additive model SDR(t) = a + s(t) from 2001. The estimated 95% CI shown as shaded: these values are probably underestimated since the observations are not independent.

These recent values do not contradict the well-established fact that there was a period of mortality stalling from about 2011 and that it was more marked in the period 2011-16 than in many comparator countries. High mortality in the first quarter of 2015 attracted considerable concern, as did high mortality in early 2018, which has continued into 2019. In contrast, more recent values have attracted little attention. Mortality has been consistently low throughout the last set of quarterly values: Q3 and Q4 of 2018 were the lowest recorded quarterly values. The first quarter of 2019 was equal lowest with the exceptional value of Q1 2014, but 9% below the corresponding value in Q1 2018. Q2 2019 SDR was the lowest value since the series started in 2001, over 2% below the next lowest value even though it contained a heatwave in late June, although some of any additional deaths will occur in Quarter 3, when there was another heatwave in late July.
Data on short-term changes, especially those using atypical baselines, are a poor basis for drawing conclusions about underlying trends. Caution is required before over-interpreting a single year’s data as happened for 2015, although in that case, the English SDR values in the last two quarters of 2015 were actually lower than those in 2014. Annual fluctuations have been driven mainly by those in winter mortality, whereas longer-term changes are more influential in other seasons. While random events such as epidemics can produce temporary increases, the mechanisms that might be responsible for a short-term substantial decrease in non-winter mortality are less obvious. The magnitude and consistency of mortality improvement in each quarter in the past year suggests that more attention be given to monitoring recent figures.
Conclusions
England is unusual in providing up-to-date sub-annual, age-adjusted estimates. Provision and dissemination of more timely and relevant data across the UK, however, would improve understanding and monitoring of trends: for example, by publishing and publicising more timely annual life expectancy data across the UK. Even the rolling 4-quarter moving average trend data presented above require aggregation of four separate quarterly series.
The very recent substantial improvements in mortality in England were largely unexpected (unfortunately, similar data are not available elsewhere in the UK) as was the earlier stalling, but such events provide especially useful information for testing some of the hypothesised explanations for recent trends, such as UK Government austerity policies or reduced real health and social care expenditure, that have been largely based on correlations of relatively short runs of macro-level time series. Recent national mortality trends are likely to attract considerable attention in any forthcoming election campaign, and the need for understanding recent movements is clear.
_____________
Mike Murphy is Professor of Demography at LSE and International Visiting Professor at the University of Helsinki.
All articles posted on this blog give the views of the author(s), and not the position of LSE British Politics and Policy, nor of the London School of Economics and Political Science. Featured image credit: Pixabay (Public Domain).