With the close of polls rapidly approaching, how is this evening likely to develop? The question everyone want an answer for is which way will the final result go, but it will be a long period between the first results come in and the final declaration, estimated to be around 6 or 7 tomorrow morning. Carl Cullinane seeks to explore what might happen in between.
In order to both give a rough picture of how the evening might go, and to provide a baseline by which early results may be interpreted, I’ve put together this data. It may be off-base, but on the other hand may provide some illumination in the gloom of the early hours after polls close.
I have used polling data from 5 polls conducted in September 2014, two from ICM, two from Survation, and one from TNS-BMRB. These were chosen as they provided breakdowns of likely voting preference by Scottish electoral region. While each individual poll had very low sample sizes in each region, and thus it is difficult to draw any conclusions, when the data is pooled it provides a sample with at least circa 500 respondents in each region. The more recent polls were weighted higher.
As there are only seven electoral regions, and results will be announced by the 32 Scottish local authorities, I have used Index of Multiple Deprivation data, which is highly correlated with likelihood to vote ‘Yes’, to crudely model variation with the regions. This gives us the following estimation of how the vote could break down by council area tonight:
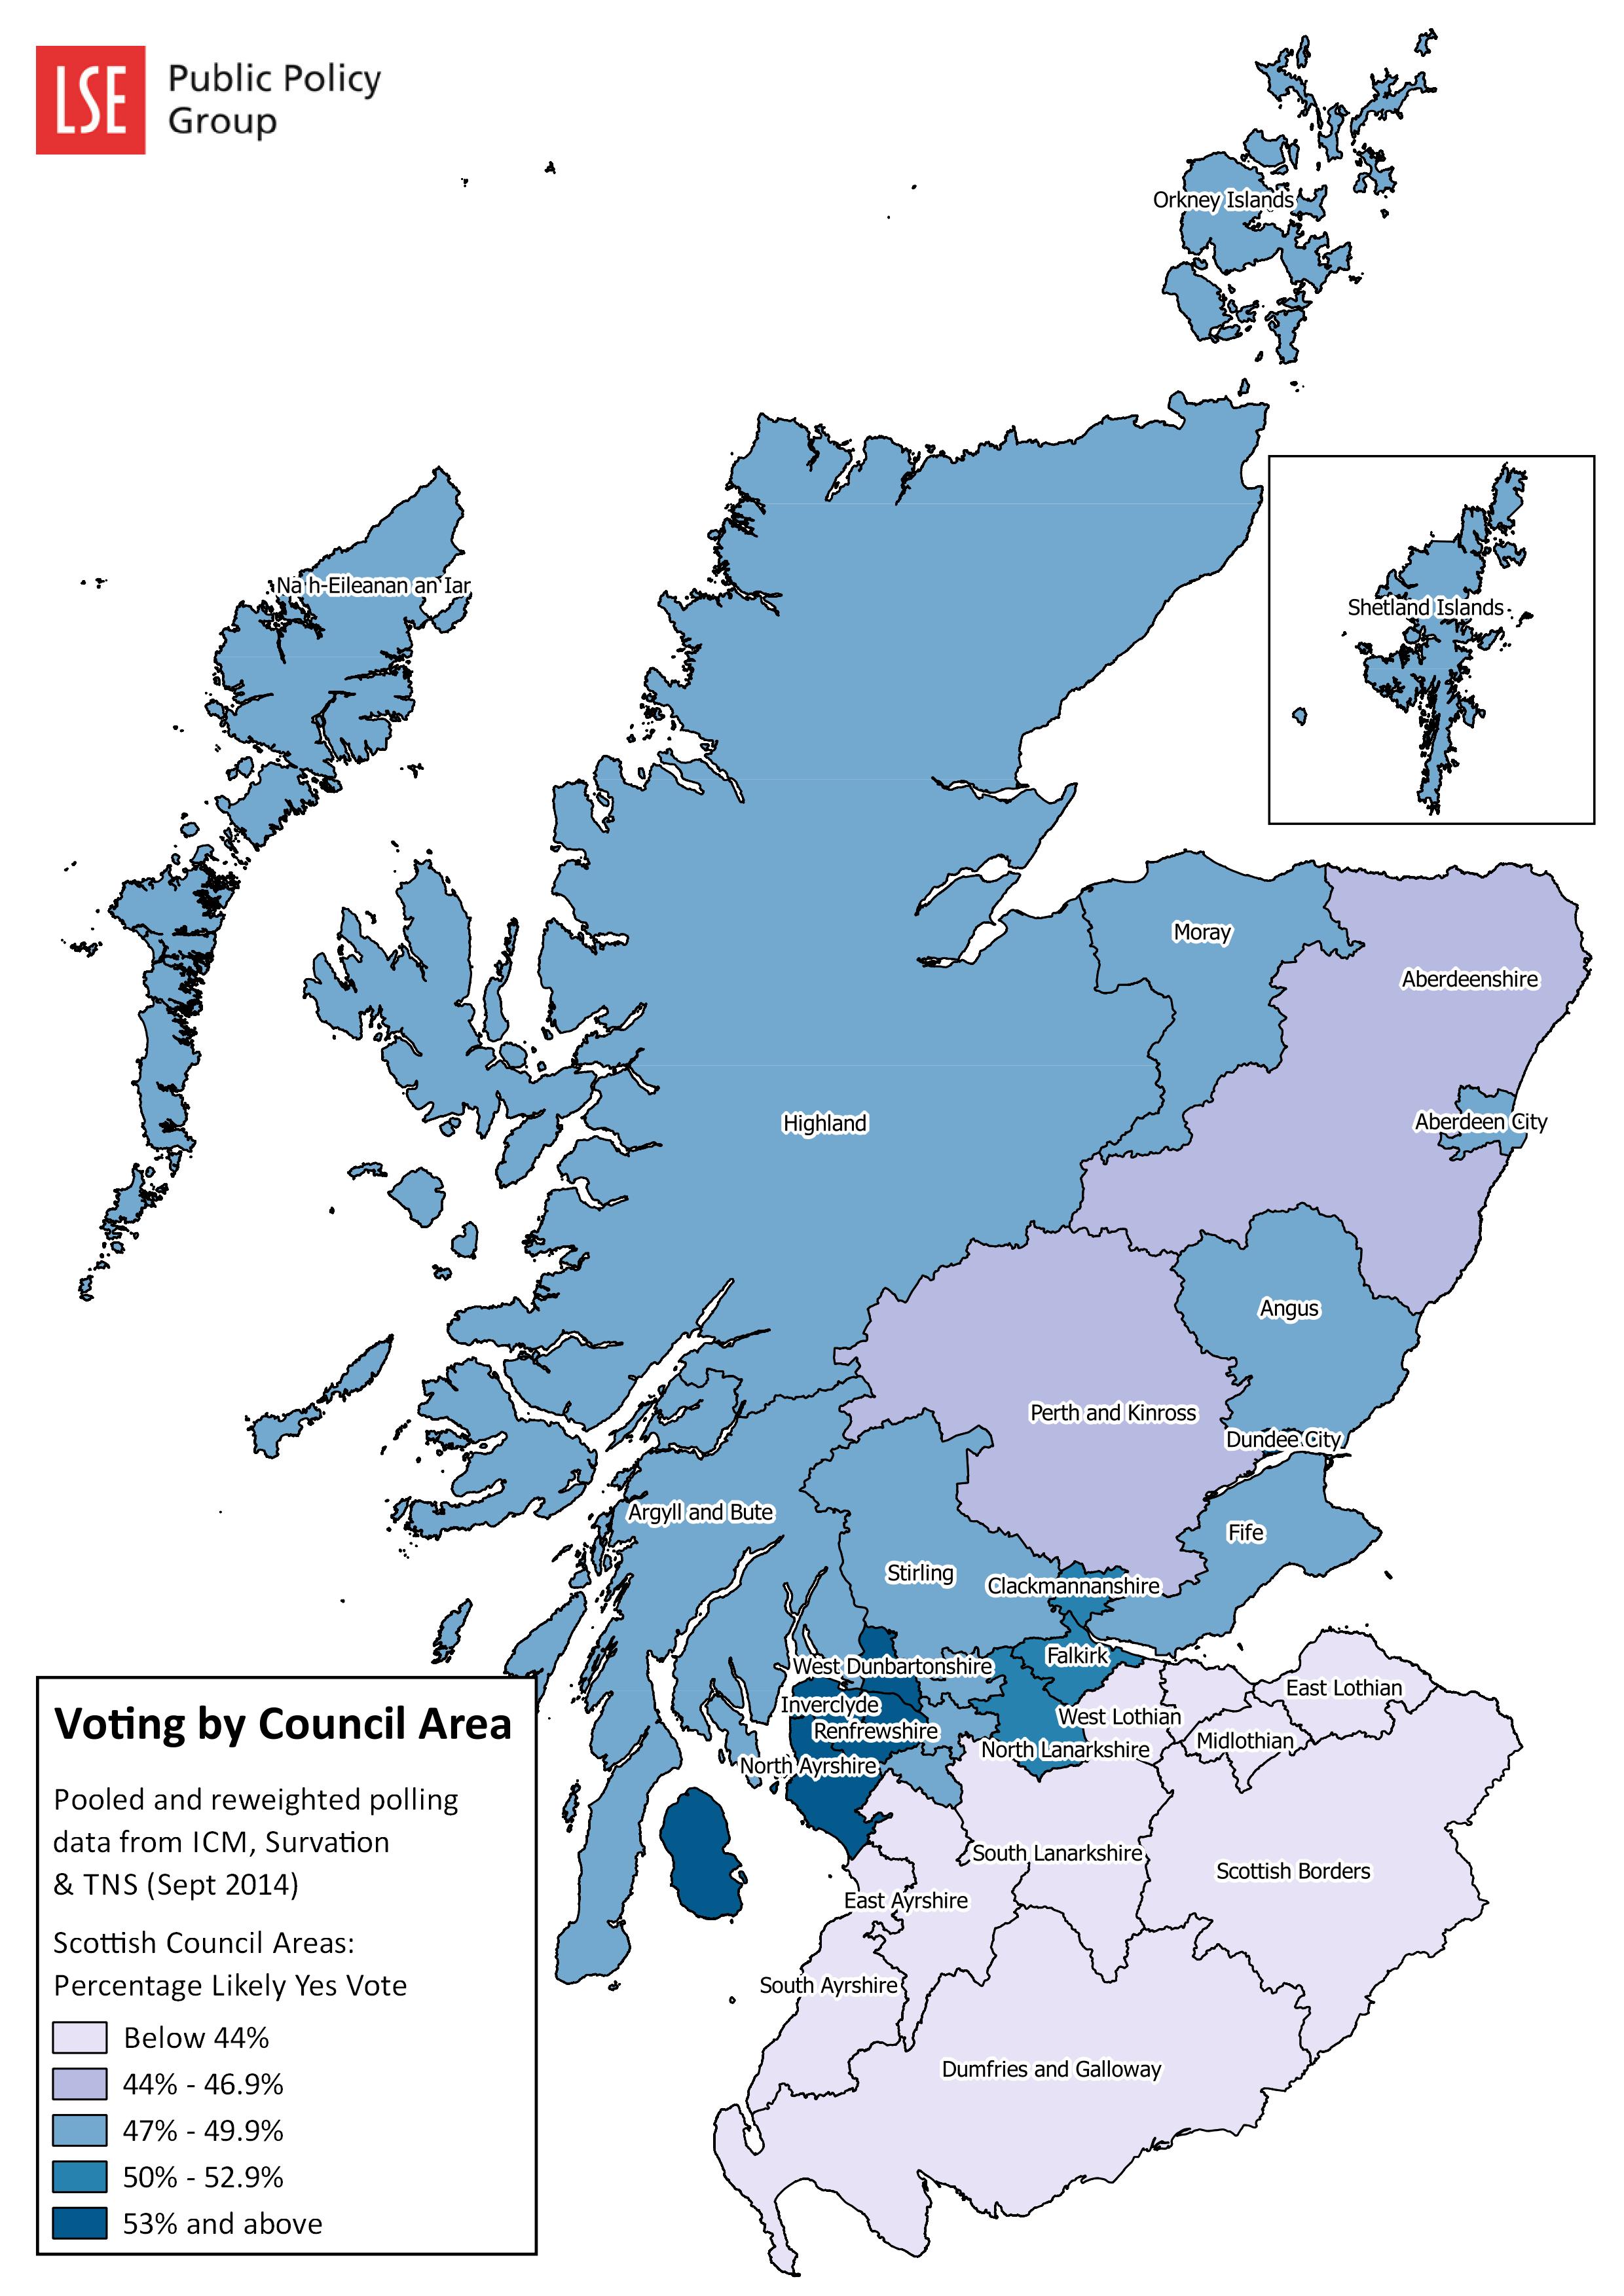
This data equates to a 53%-47% win for the ‘No’ side. This is perhaps a slight overestimate of the gap, if one could take all the polls into account, but nonetheless provides a baseline by which results may be compared. It’s clear that the strongest ‘Yes’ support is concentrated in a central belt of the country, with the north generally tending towards a soft ‘No’ and the south of the country a very hard ‘No’.
The next question is how to use this data to inform early assessments of vote shares. The Press Association has published estimates for the timing of the announcement from each council count venue. There are wide variations due to geography, transport, and population density. Estimates are obviously subject to a lot of error due to logistical issues, high turnout, or local recounts, but are illustrative of how the night is likely to take shape. Geographically, the announcement estimates look like this:
The next step was to find out more about turnout. While the final electoral register data is not yet available, combining council level breakdowns of electoral registers as recorded in March this year, and scaling them up to the total registered electorate of 4,285,323 announced last week, I was able estimate of the current electoral register in each council area. For the purposes of this analysis, I have then assumed the widely predicted figure of an 80% turnout rate among registered electors. If reached, this would be highly impressive historically speaking, but all indications are that it may even be surpassed. I then used turnout data from the 2012 local elections and the 2014 European elections to roughly model differential turnout by council area.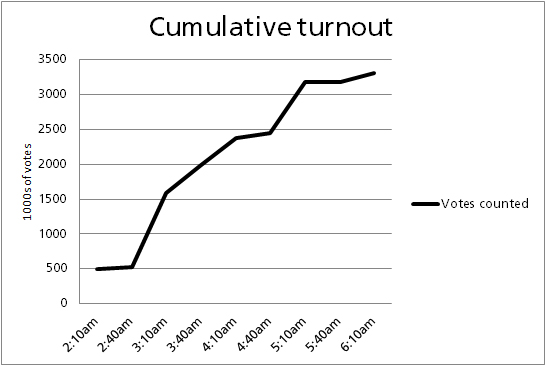
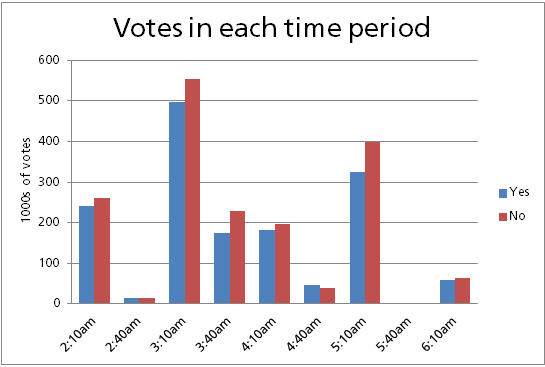
By combining these numbers with the local level polling estimates and the timing information, it’s possible to build a very rough picture of how the night may go. The graph above shows the likely cumulative trend of votes counted, assuming an overall turnout rate of 80%. There is a huge jump around 3am, and again around 5am, as the most populous areas announce their results. Thus, the result is likely to be still in the balance until the announcements around 5am, with several of the largest areas, including Edinburgh and Glasgow Cities, due to finish counting as dawn approaches.
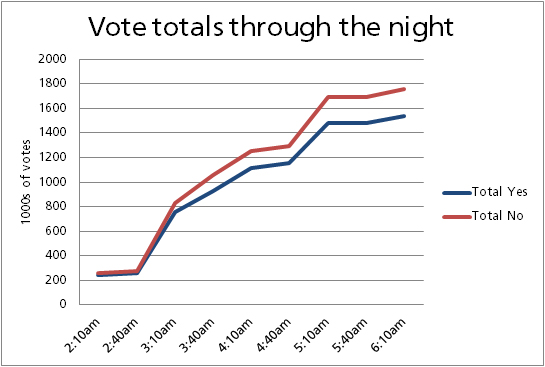
Perhaps more interestingly, the second graph shows how the two campaigns may accumulate votes though the evening. It is likely to be very close at the beginning, as several areas with strong ‘Yes’ votes are included, but with the ‘No’ campaign edging ahead slowly as the night goes on. With the polling data we have available, it seems that ‘Yes’ is unlikely to be ahead at any stage. If it does take an early lead, it would be significant. However, given the pattern of announcements, a narrow early ‘Yes’ lead would still likely be overtaken.
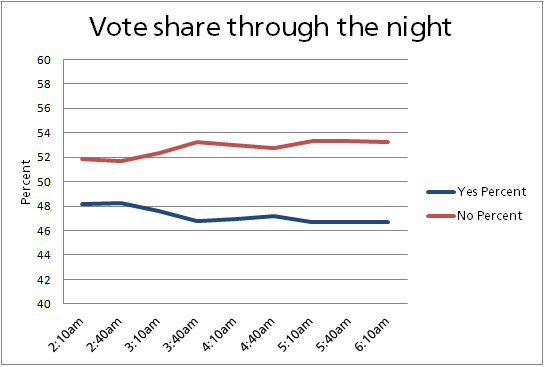
The trend is even starker when you look at the potential development of voting share. Between 3am and 4am, ‘No’ consolidates and stretches its lead, remaining relatively steady for the rest of the night. This jump is explained when looking at the likely balance of votes declared in each time period.
Given the lack of previous similar referenda to guide us, and the often small polling sample sizes, we remain necessarily in the realms of speculation. These estimates may be wildly off-base, depending both on the validity of the assumptions, together with the potential for factors that could never have been predicted. Nonetheless, it may paint, an admittedly blurry and uncertain, picture of how the night may progress, and a offer benchmark for how the two camps are getting on once the real counts finally start coming in.

Note: This article gives the views of the author, and not the position of the British Politics and Policy blog, nor of the London School of Economics. Please read our comments policy before posting. Featured image credit: John Keane CC BY-SA 2.0
Carl Cullinane is Research Assistant at the Democratic Audit, and is responsible for conducting in-house research along with contributing to the blog and other DA outputs. He holds a degree in Philosophy and Political Science from Trinity College Dublin in 2005, along with MSc’s in Philosophy & Public Policy from the LSE and Applied Social Research, also from Trinity College.
He has worked for the Irish Ombudsman for Children, the Economic and Social Research Institute, and NatCen Social Research. He joined the Democratic Audit in Summer 2014, and can be found on twitter at @cullinanecarl