Susan McVie, Ellie Bates, and Rebecca Pillinger examine long-term change in violence within Greater London and the old Strathclyde region and ask whether there really is evidence of Scottish exceptionalism in patterns and trends in violence.
The recurrent press coverage of stabbings and gun crime in London acts as a sobering reminder that, even though violent crime across Britain as a whole has more than halved in the last two decades, violence continues to be a severe and ongoing problem in some communities. Since the beginning of 2018, more than 100 people have been murdered as a result of knife or gun attacks in England’s capital city, and many others have been wounded. It is startlingly reminiscent of the situation in Scotland just over a decade ago when the homicide rate in Glasgow was higher than any other major city in Western or Central Europe, and more than double the European average. The number of violent deaths was so high that in 2005 the World Health Organisation reported that Scots were three times more likely to be murdered than people living in England and Wales; Glasgow was dubbed the ‘Murder Capital of Europe’.
Much has been done since the mid-2000s to address the ‘wicked problem’ of violence that afflicted many communities in and around the city of Glasgow. Fed up with dealing with Glasgow’s addiction to violence, the then Strathclyde Police Force secured funding from the Scottish Government to establish the Violence Reduction Unit (VRU). A small crack-unit of officers took up the challenge of targeting all forms of violence in Glasgow, but especially gang-related crimes involving knives and other weapons which were mainly perpetrated by young men. Very quickly, the VRU’s Director, Superintendent John Carnochan, realized that to achieve its aims he would need to take a radical new approach to tackling violence, primarily by addressing it as a public health, rather than a criminal justice, problem. Since the inception of the VRU, the total number of homicides recorded in the City of Glasgow has declined by an astonishing 65%, and there have been similar if not higher reductions for other non-fatal types of violence.
The recent upsurge in homicide and violence in London has created widespread speculation about whether there is a degree of ‘Scottish exceptionalism’ in how violence was dealt with north of the border. Indeed, the recent announcement by London Mayor Sadiq Khan that a Violence Reduction Unit, modeled closely on the Scottish initiative, is to be established in London suggests that the question of Scottish exceptionalism has been answered. But, so far, no one has provided any actual empirical evidence that Glasgow has performed differently to London, or indeed the rest of Scotland, in terms of its violence rates and trends.
Creating a dataset to compare cross-border violence
Comparing rates of violence in Scotland and England is not a simple process as there are different legal systems and different definitions of what constitutes violent crime. We took on the challenge of collating a comparable dataset that allowed us to measure the number of violent crimes recorded within local authorities in Scotland and Community Safety Partnerships in England and Wales. We included all types of non-fatal violence, ranging from minor assault involving no injury to attempted murder, but excluded murder and homicide due to definitional issues. The data covered a period of 12 years from 2004/05 (following the introduction of the new Crime Recording Standards in England and Wales) to 2015/16. The violence data was converted into rates per 100,000 people in order to take account of differing population size across local authorities.
Using this dataset, we set out to identify how violence had changed over time in two main regards: firstly, the relative level of violence between different local authorities; and secondly, the trend in violence within each local authority. We conducted this analysis for the whole of Britain; however, here we focus on the findings for the Greater London region (which includes 33 local authorities, including the City of London) and the former Strathclyde Police Force Area (which includes 12 local authorities, including the City of Glasgow) as these are the areas of most prominence in recent media headlines.
Was there similarity in levels of violence?
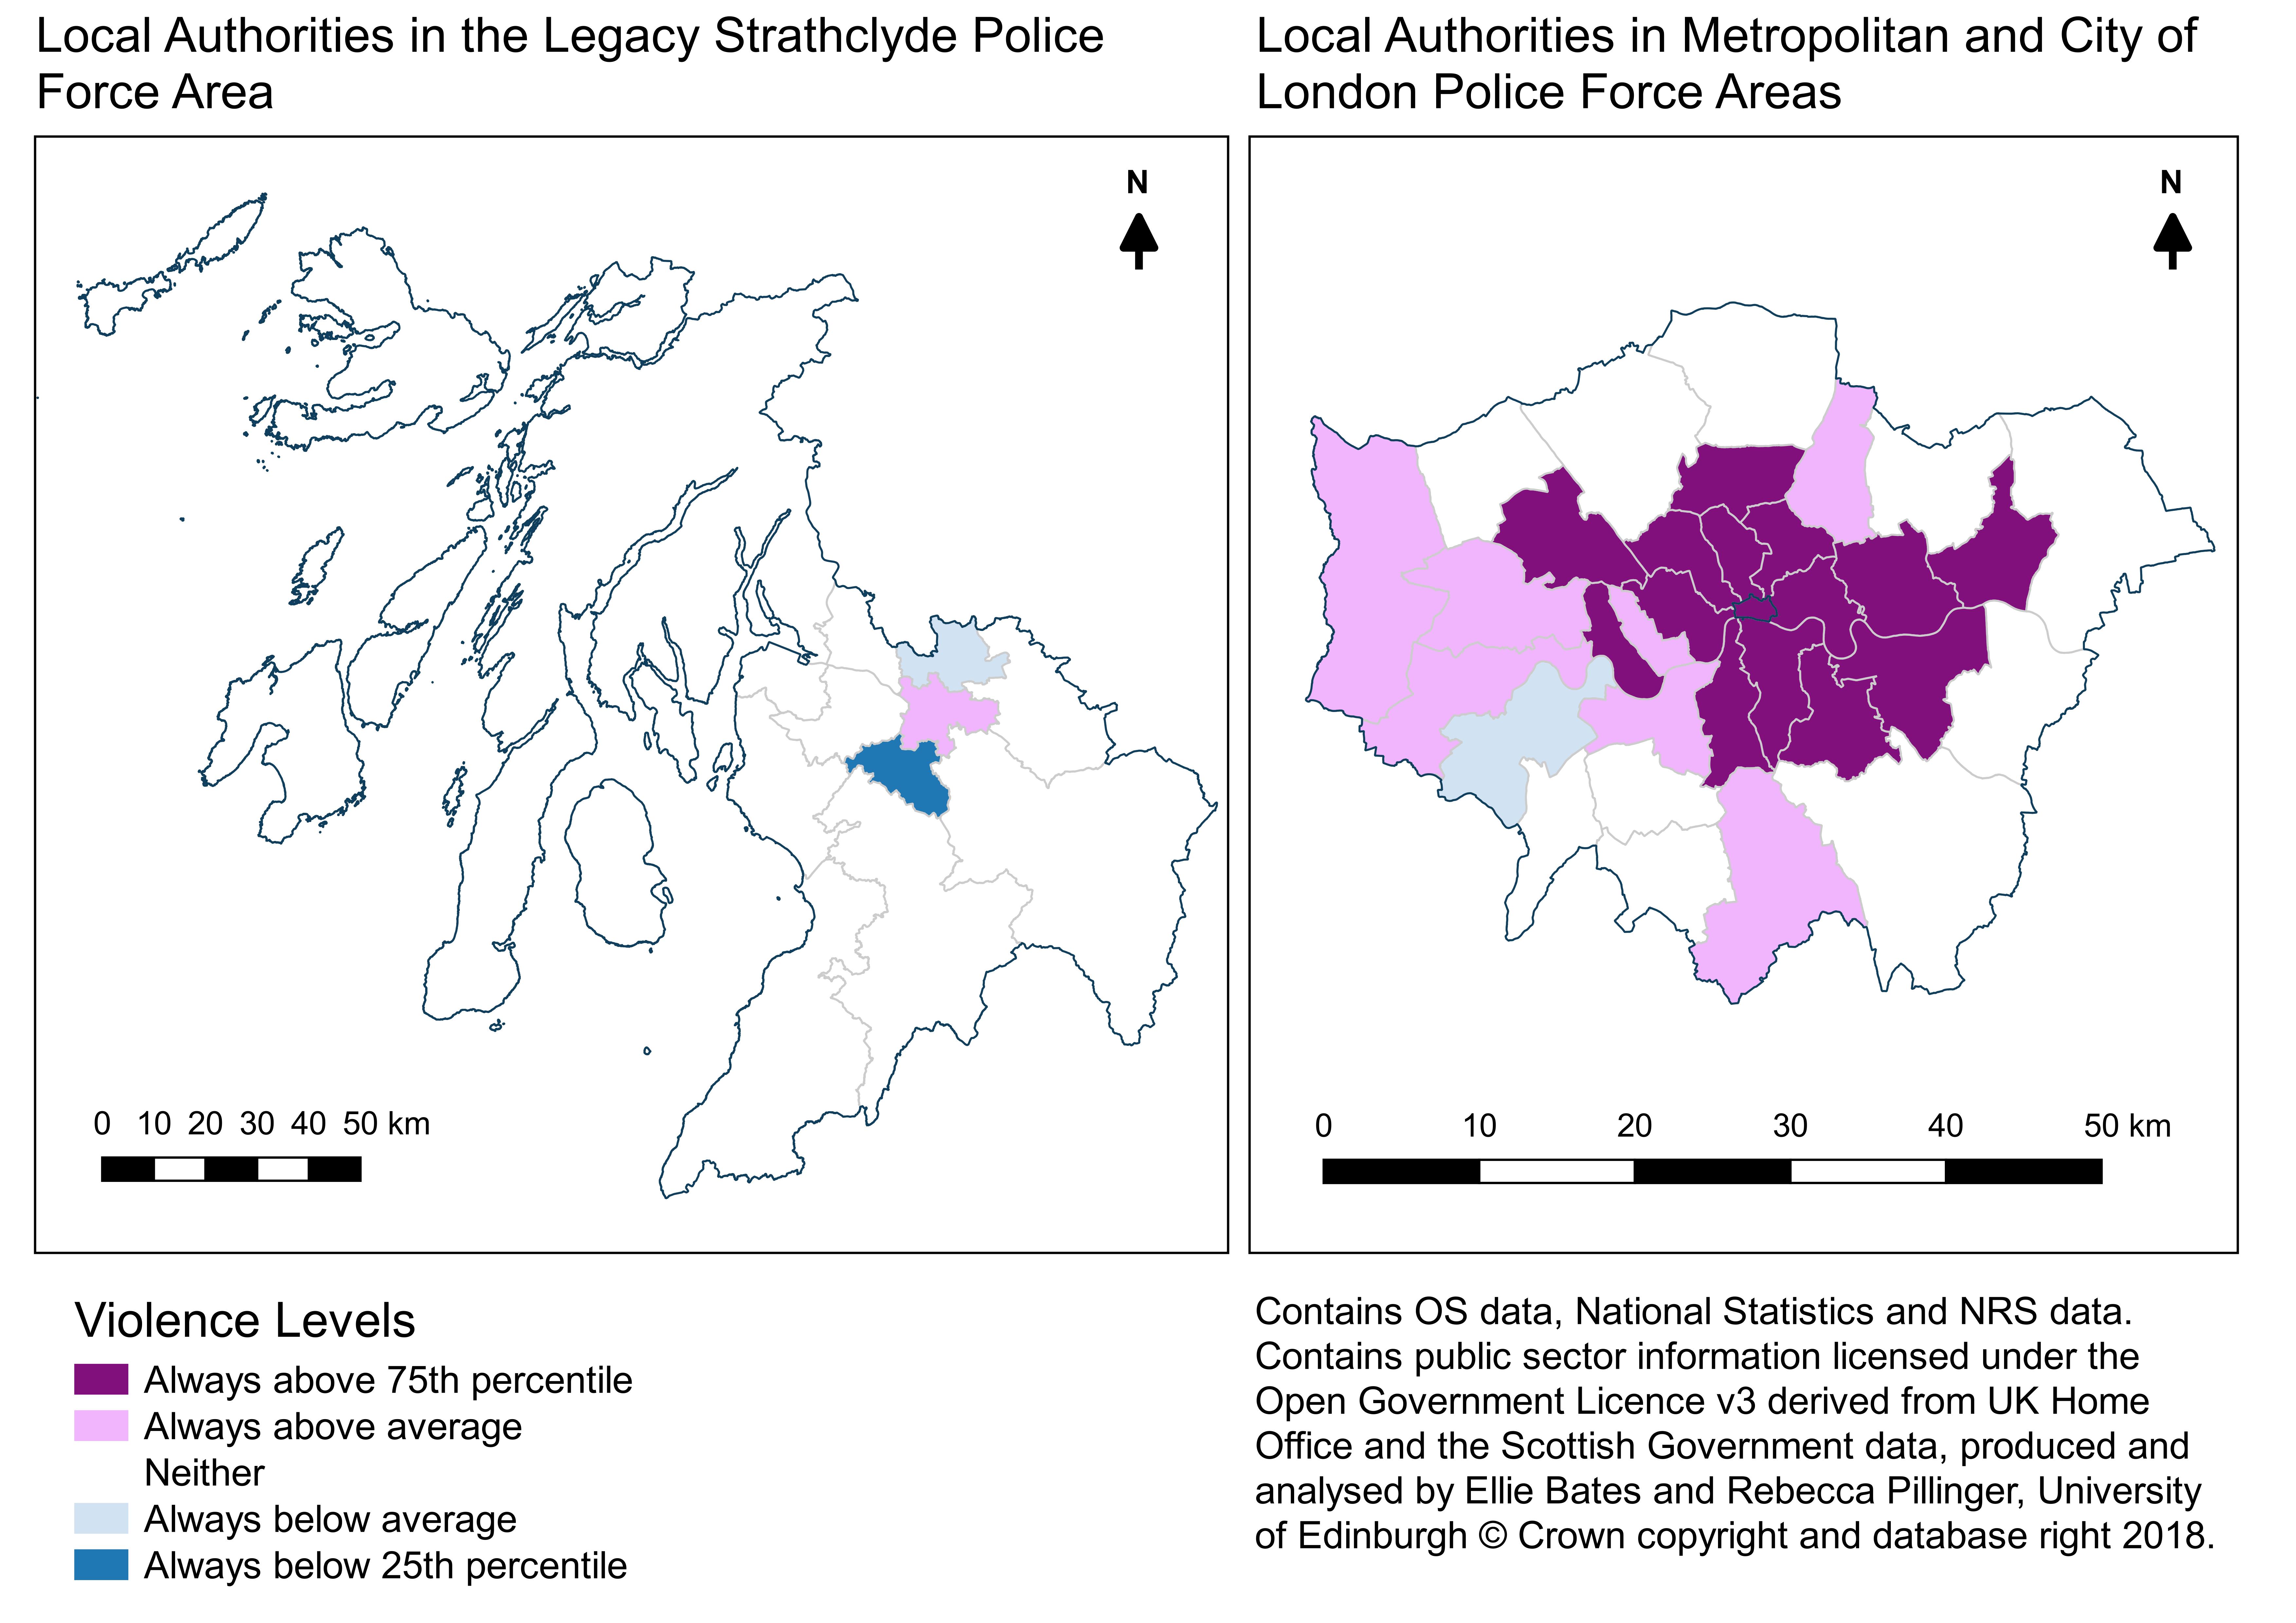
Map 1 shows the difference between Strathclyde and Greater London in terms of levels of violence over the 12-year time period. This tells us which local authorities had a violence rate that was consistently above or below the average for the whole of Britain. Looking first at Strathclyde, only one of the 12 local authorities had a violence rate that was consistently above the British average across all years: the City of Glasgow. However, it was not amongst the British local authorities that were consistently in the top 25% most violent. Two of the Strathclyde local authorities had below average violence rates, one of which was consistently among the 25% least violent. However, violence rates in the majority of local authorities in Strathclyde were not consistently above or below the British average in every year.
Looking now at Greater London, Map 1 shows that about half (15) of the local authorities – mainly those in central London – were consistently ranked among the top 25% most violent areas in Britain over all 12 years. A further six local authorities had a level of violence that was consistently above average over the same time period. Notably, only one local authority in Greater London (Richmond upon Thames) had a level of violence that was consistently below average, while the few remaining local authorities – all on the periphery of Greater London – were neither above nor below average in every year.
From this analysis, we can conclude that levels of violence were consistently far higher in Greater London than they were in the Strathclyde region of Scotland over the period from 2004 to 2016. Indeed, the local authorities of inner London were consistently amongst the most violent in Britain and this persisted over a 12 year period. Glasgow City’s level of violence was consistently higher than the British average, but it did not reach the threshold of being in the top 25% most violent local authorities every year. Therefore, any comparison of violence rates in Scotland and London should take account of the fact that London had a much higher threshold of violence over this period. Importantly, most of the local authorities within Strathclyde had violence rates that were not consistently above or below average, which shows there was no widespread clustering of persistently violent areas within Strathclyde which differs greatly to Greater London.
Map 1: Difference in levels of violence over time between Glasgow and London
What about similarity in trends?
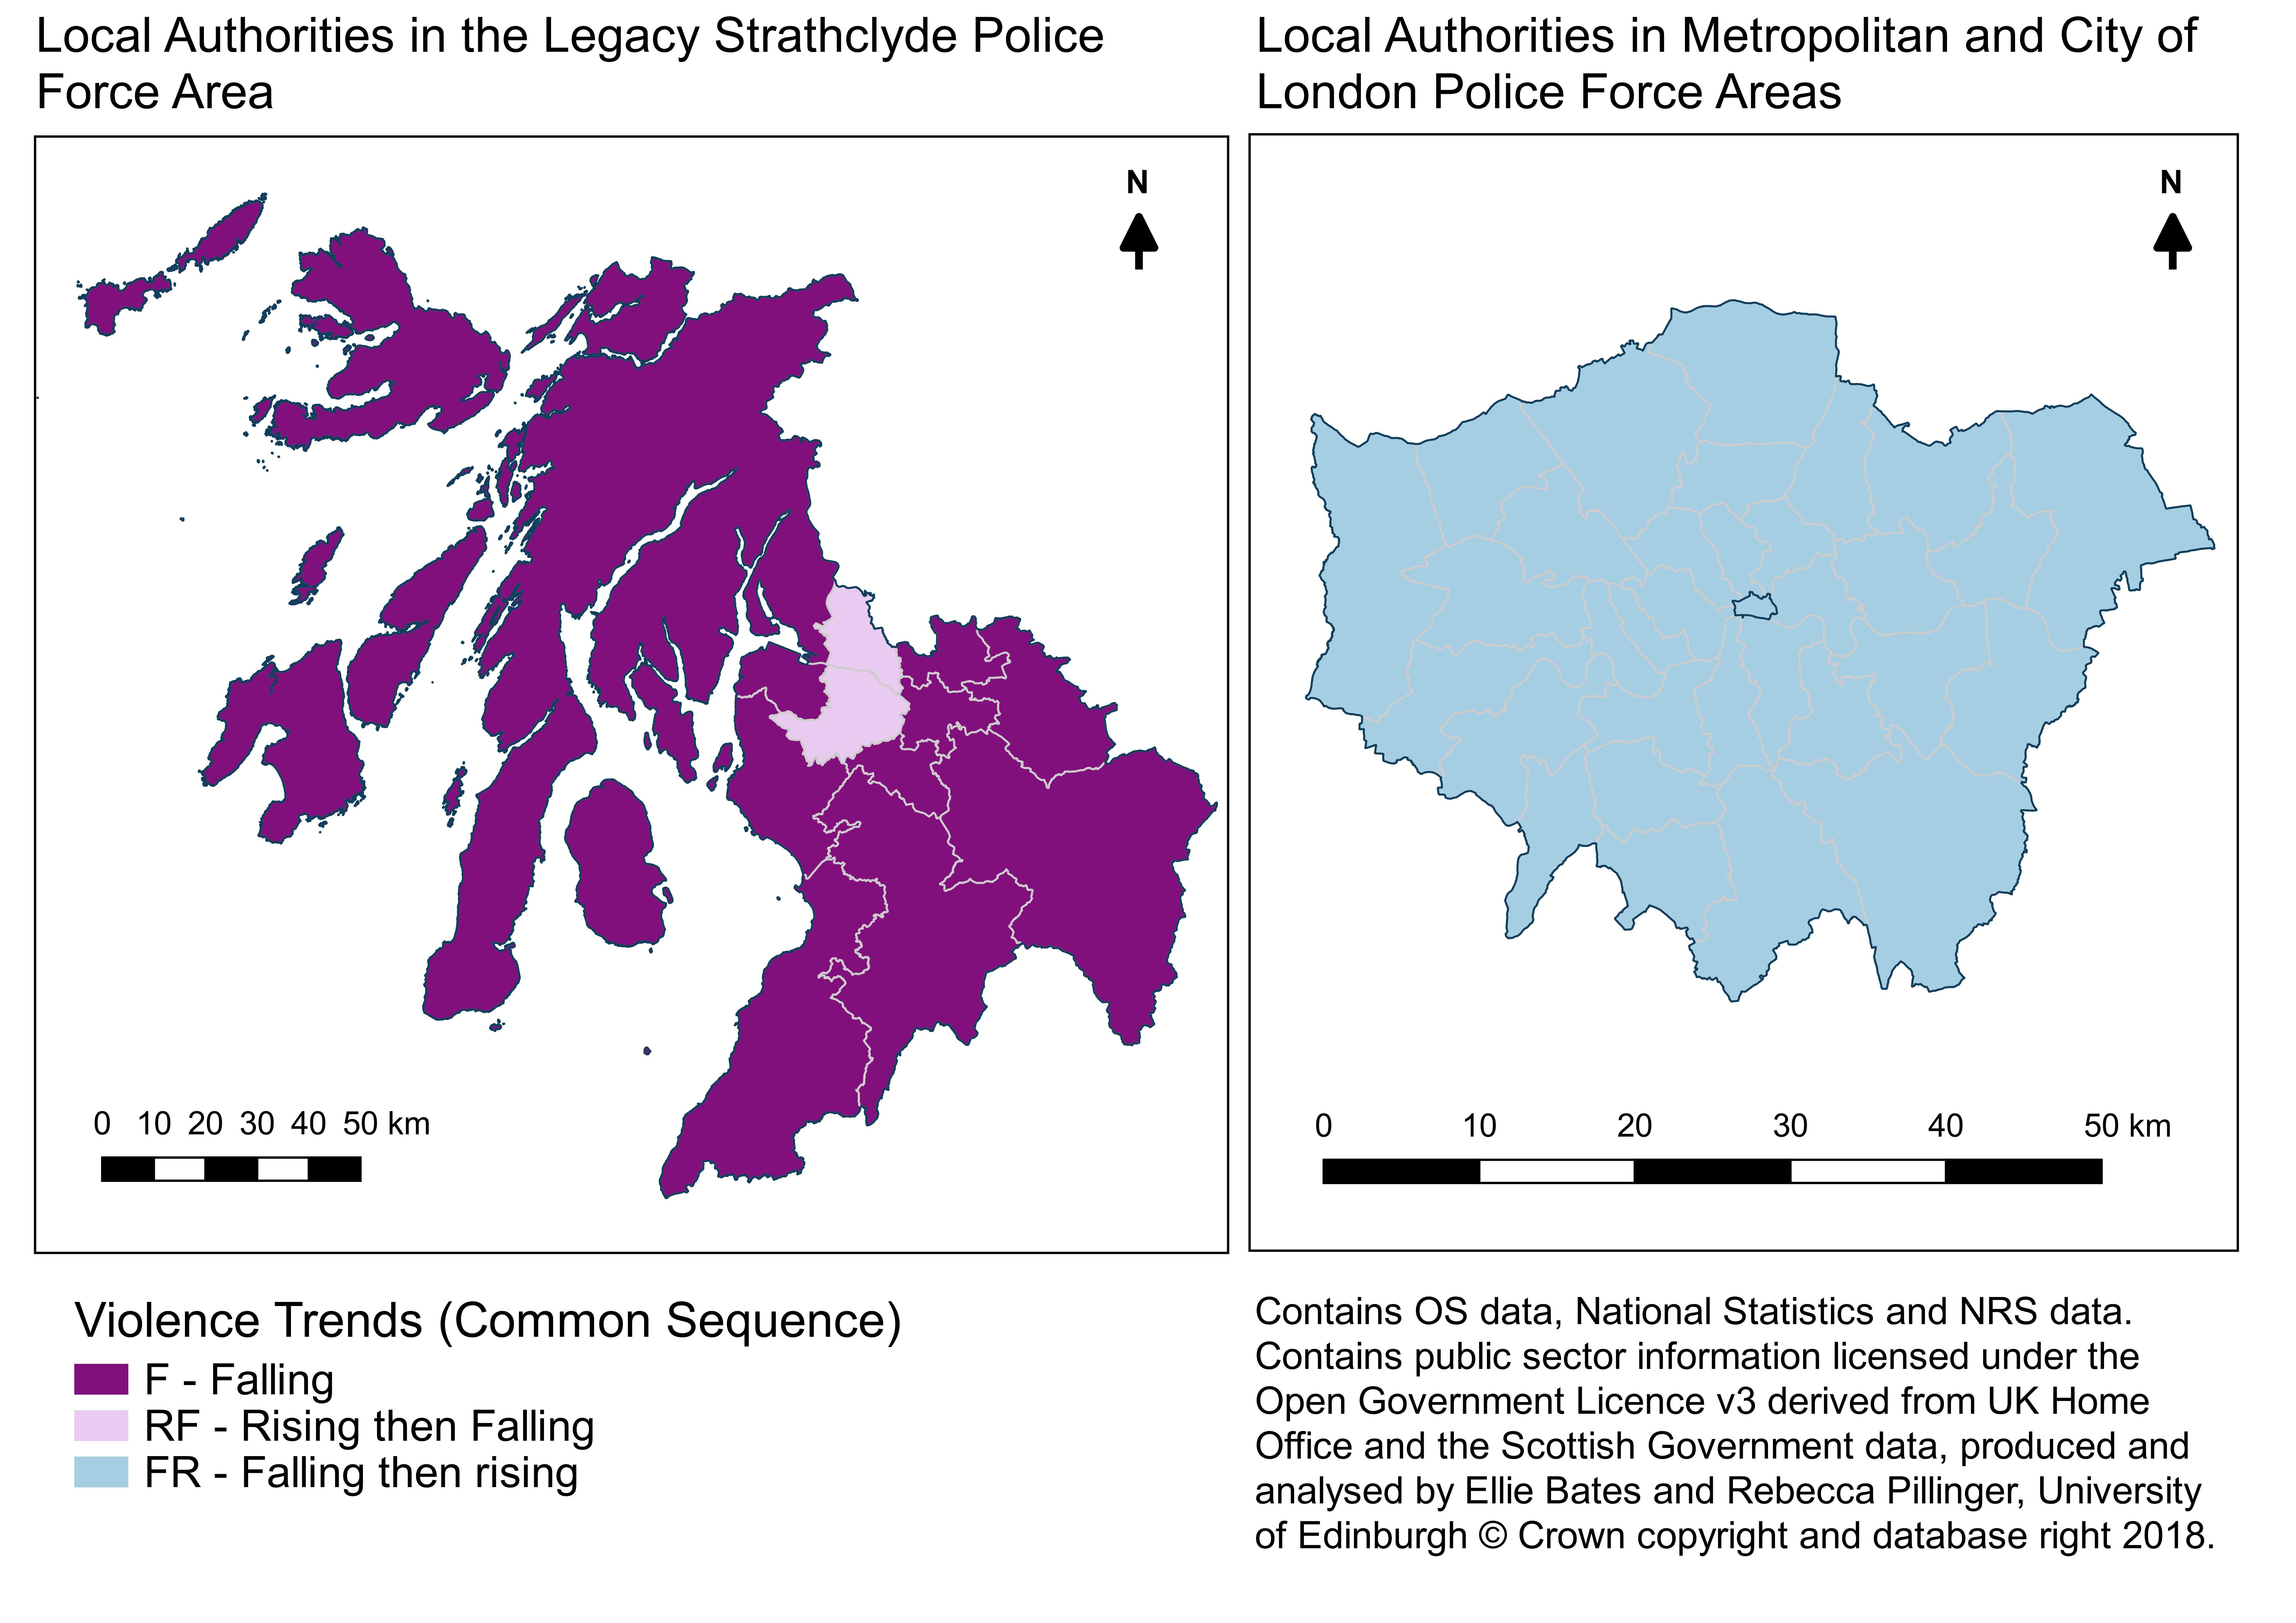
We now turn to the trends in rates of violence. Our analysis found three common trends over this period across all British local authorities: a ‘falling trend’ where we could detect a reduction in violence but no period of rise between 2004/05 and 2015/16; a ‘rising then falling trend’ where we could detect a rise in violence followed by a fall but no other change; and a ‘falling then rising trend’ where we could detect a fall in violence followed by a rise but no other change.
Map 2 shows significant divergence in violence trends between local authorities in Strathclyde compared to Greater London. All but two of the local authorities in the Strathclyde Police Force Area showed a falling trend during all or part of the time period in question. The remaining two areas (including Greater Glasgow) showed a rising then falling trend. On the other hand, every single local authority across Greater London showed a falling then rising trend between 2004/5 and 2015/16. In other words, violence rates fell to some extent across all local authorities during this period, but the Greater London authorities showed a subsequent rise in violence before the end of the period whereas the Strathclyde authorities did not.
Map 2: Difference in violence trends over time between Glasgow and London
To investigate these differences further, we examined the timing of the highest and lowest rates of violence in each local authority. In Greater London, we found that the violence rate for all but five of the local authorities was highest in or before 2004/05; however, four authorities – including the City of London – recorded their highest rate of violence in 2015/16. This means that the turning tide of violence in these four authorities resulted in levels that were even higher than they were at the start of the period. In addition, the lowest rate of violence for all Greater London local authorities was in 2012/13 or earlier. On the other hand, the peak year for violence in Strathclyde was no later than 2007/08 for any local authority; and the lowest rates of violence were recorded in 2013/14 or later.
So was there Scottish exceptionalism in changing patterns of violence?
The findings presented here demonstrate stark differences in both levels and trends of violence in Greater Glasgow and its surrounding authorities compared to those in Greater and Central London. We have shown that violence levels in Greater London were consistently amongst the highest in Britain over a 12 year period in which violence as a whole was declining significantly and that there was a strong clustering of local authorities that were consistently amongst the top 25% most violent. While violence levels within City of Glasgow were consistently above the British average, they did not reach the same threshold as those for Greater London, and we did not find the same type of clustering across adjacent Scottish local authorities. While the scale of the geographical areas involved here are quite different, this degree of concentrated violence across different local authorities may have an important bearing on the difficulties faced by the Metropolitan Police in trying to significantly reduce violent crime. It is not certain whether this was a factor in reducing violence in Glasgow.
We have also shown that all local authorities included in this analysis experienced a downward trend in violence; however, the tide started to turn in Greater London on or before 2012/13, while it continued to fall across most of Strathclyde. This strongly suggests that whatever factors influenced a change in the trajectory of violence in London were not experienced in Glasgow, which is indicative of some degree of Scottish (or possibly London) exceptionalism.
What these factors were is open to debate. There has been much speculation that the VRU was a key driver in this process. The potential impact of the VRU is somewhat confounded by the general similarities in falling violence across both study areas, although it is possible that the VRU played a role in keeping violence low in Greater Glasgow during the latter period, at the time it was starting to rise again in London. Without specific evaluation of the role that the VRU played in reducing crime in Greater Glasgow, however, this is difficult to prove.
This study highlights two key problems. Firstly, the lack of systematic long term analysis of crime trends and their causes; and secondly, the paucity of evaluation data for initiatives like the VRU. Both problems contribute to the type of speculation we have seen around the differential trends in violence north and south of the border. While it may well be that the solution to London’s current violence problem is to set up a VRU of its own, it is by no means certain that this will be the panacea that Sadiq Khan, the Metropolitan police and the people of London so desperately desire.
__________________
Note: This research was funded by the Economic and Social Research Council for the AQMeN Research Centre (Grant Reference ES/K006460/1). The data on which the research was based is lodged with the UK Data Service (Study Number 852854). Further information about the AQMeN Research Centre and its work on projects relating to crime and victimization can be found here.
 Susan McVie is Chair of Quantitative Criminology and Director of the Understanding Inequalities project based in the School of Law at the University of Edinburgh. She was Director of the AQMeN from 2009 to 2013.
 Ellie Bates is Senior Information Analyst with the Public Health and Intelligence Division of NHS National Services Scotland. She was an AQMeN Research Fellow from 2014 to 2017.
 Rebecca Pillinger is a Statistician in the Usher Institute of Population Health Sciences and Informatics, University of Edinburgh. She was an AQMeN Research Fellow from 2013 to 2017.
All articles posted on this blog give the views of the author(s), and not the position of LSE British Politics and Policy, nor of the London School of Economics and Political Science. Featured image credit: Pixabay (Public Domain).


Funny that it says Glasgow then the whole of Scotland is used rather than just Glasgow although of course the Scottish population as a whole is less than that of London. Additionally most of the people in Scotland are Scottish, unlike London which is highly cosmopolitan and has far more divine group culture because of the foreign citizens clubbing together.