 Last week the Ministry of Justice published its interim evaluation of the ‘payment by results’ (PBR) pilots at Peterborough and Doncaster prisons. Designed to test out how PBR might create sustainable mechanisms to reduce prisoner reoffending, the pilots can now tell us something about reconviction outcomes. The results, says Simon Bastow, are modest and hardly the stuff of revolution. Indeed, they show how affecting change in a complex policy system is an incremental game.
Bringing about ‘rehabilitation revolution’ in the prison system was never going to be easy. This is an area, after all, that has suffered from a persistent sense of fatalism over the decades about the extent to which prisons can or should be expected to rehabilitate. And the fact that the system has prided itself on running at close-to-tolerance levels of capacity day-in day-out has also sustained a healthy appreciation of the constraints on the realms of possibility in this area.
So the PBR pilots at Peterborough and Doncaster have afforded opportunity to see what is or may be possible when prisons and those that work in them are directly incentivized to focus on rehabilitative outcomes. What might we expect in terms of reduction of reconviction rates from such explicit attention? And what is the potential for changing cultures and mind-sets around rehabilitation? This interim report provides a useful insight into the size of the challenge.
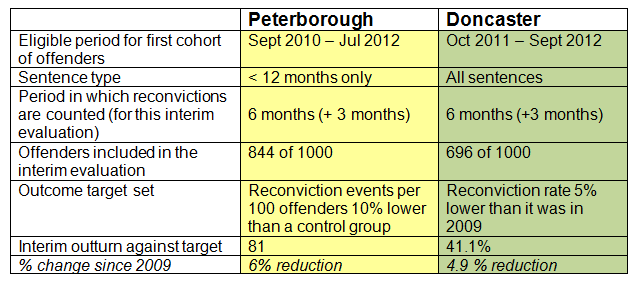
At Peterborough, the pilot started in September 2010, and has tracked the reconviction rates of a cohort of prisoners sentenced to less than 12 months. At Doncaster, the pilot started a year later, and tracked reconviction rates of prisoners of all sentences. For this interim analysis, offenders were tracked for a period of 6 months (+3 months) after release from custody (whereas in the final assessment, offenders will be tracked for 12 months (+6 months). As Table 1 below shows, the criteria on which reconviction outcomes were judged varied between the two prisons.
Table 1: Headline interim outturns from the pilots
A lot hinges, of course, around the baseline or threshold that triggers payment for successful results. For Peterborough, this baseline will be a yet-to-be-decided ‘control group’ based on national reconviction outcomes. In absence of a control group, the report compares reconviction outcomes against the equivalent 2009 level. Here the requirement is that the number of ‘reconviction events’ per 100 offenders should decrease by at least 10 per cent for payment mechanisms to be triggered. Compared to the 2009 level, the reduction is 6 per cent. For Doncaster, the requirement is slightly different in that it is the actual reconviction rate (i.e. the percentage of offenders reconvicted) that should decrease by at least 5 per cent. The outcome in this interim cohort is 4.9 per cent.
What should we make of these results? Not surprisingly, Chris Grayling and the Ministry have described them as ‘encouraging’, heading in the right direction, and so on. Indeed, as the report shows, national reconviction rates have continued to climb, whereas the pilots have shown that trends can at least be set in reverse.
Four to 6 per cent change, however, seems modest. One might expect an individual prison, incentivized explicitly over at least two years to reduce the rate of reconviction amongst 700 or 800-or so prisoners leaving its care, would be able to make more than a 4 to 6 per cent impact. In Doncaster, this equates to changing the behaviour of 1 prisoner in every 20 prisoners released. In fact, as the report suggests, this is a continuation of a trend that had started in Doncaster long before the pilot was introduced. In Peterborough, the equivalent marginal impact is more like 1 prisoner in every 40.
Are there signs of threshold effects? Here providers would do just enough to get over the threshold and trigger payments, but not much more. In both cases, neither pilot exceeded its threshold, so this does not seem to be an obvious problem. In the case of Doncaster, the outcome lags by only 0.1 per cent behind the threshold, and we assume that that would not have triggered payment. It is unlikely that this has been gamed therefore. In theory, the idea of ‘threshold gaming’ is often attractive, but in reality it is much harder to micro-manage performance, especially in an area like reconvictions where there are so many external variables at play. In the case of Peterborough, the outcome lags 4 per cent behind the threshold, even if it is an indicative baseline rather the control group measure that is planned. One wonders what implications this would have for commercial viability for providers and investors.
Underpinning all this are important questions around how we calibrate acceptable thresholds of rehabilitation success, i.e. how the control group is constructed and what ‘black box’ assumptions are made. Lurking in the report is reference to the Offender Group Reconviction Scale (OGRS), a modelled predictor of re-offending based on the particular profile of an offender group in question. Put simply, this allows analysts to control for variations in severity of sentence and misdemeanour in the offender group, and to calibrate actual rehabilitation outcomes accordingly. This difference between actual (i.e. with no weighting for the offender profile) and notional rates of rehabilitation (i.e. weighted to take offender profiles into account) has long been central to the way in which the Ministry has reported its rehabilitative performance.
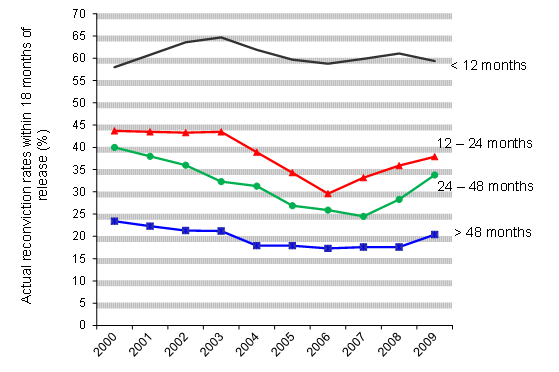
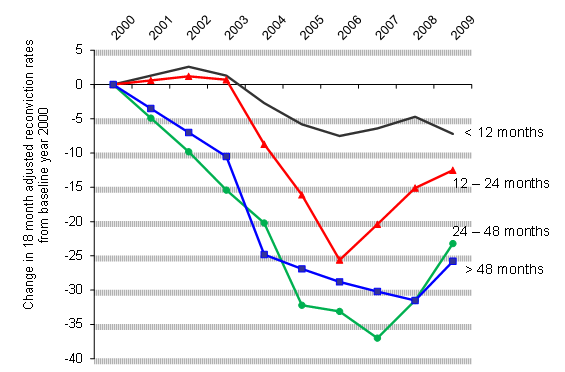
We can illustrate this variation between ‘actual’ and ‘notional’ rehabilitation’ rates in the two graphs below. These are based on Ministry of Justice data (2011). Whereas actual rehabilitation shows fairly flat trends over the last ten years, once we factor in the changes in the modelled profile of the offender population, we find that notional rehabilitation shows a much improved picture of rehabilitative performance.
Figure 1: Actual reconviction rates, by length of sentence of offender groups
Figure 2: Modelled or notional reconviction rates, by length of sentence of offender groups
These graphs illustrate the bind that the prison system faces in evaluating and communicating its performance on rehabilitation. On the one hand, it seems reasonable that we should judge performance of the system on its ability to ‘add value’ from a consistent baseline. It has after all only very limited influence over the profile of the offender population that it must rehabilitate, and if the profile is constantly changing or becoming more intractable, let’s say, then it seems fair that we should factor this underlying change into our assessment of its rehabilitative performance.
On the other hand, there are clear difficulties in talking about ‘notional’ rehabilitation and not actual real-life rehabilitation. For politicians and senior officials, the predicament is clear. Anything that needs a model and pages of technical explanation is never going to be easily sold to the public or the tabloid press. Context is death in this case. Even if the context is articulated in accessible terms, there are still irresolvable arguments about the model that is used, the ‘black box’ assumptions that are made, and so on.
For those who argue that the prison system has always struggled to articulate its own ‘successes’, this is a classic example as to why. At a notional level, the system has been successful in reducing reoffending in the last ten years. The difficulties of articulating this in real terms means that we should not be surprised if supporting evidence is buried away on page 33 (Table A5) of an impenetrably dense Ministry of Justice statistical bulletin!
The predicament therefore for the Ministry is how to calibrate a baseline for ‘success’, one that delivers on rehabilitative goals, and one that manages to align political, commercial, and analytical considerations. As these graphs show, there is broad scope within to finesse the threshold accordingly. Indeed, the construction of the control group is conspicuous by its absence in this interim analysis, and this will clearly play a deciding role in determining between success and failure of the providers’ rehabilitative efforts. As we have seen, the numbers suggest that there will be a fine balance to strike here between these various considerations.
Not surprisingly, this report is silent on the political and commercial side of things. The schemes have produced 4 to 6 per cent impact on reconviction, but at what cost to the providers and with what implications for sustainability of the PBR mechanism at large? The political and reputational pressures on both sides show that, though this is a viable model for the system as a whole, the financial costs would be absorbed in order to make a case for expansion of PBR. Government and the private sector have much invested already. So it remains to be seen how much capacity stress has been exerted on the stakeholders involved in delivering this 4 to 6 per cent marginal gain.
These are of course only interim results from the first round of experiments – and we await later cohorts and rounds of evaluation into 2014. For those who were worried that we would have to wait until 2014 for any findings or insights from these pilots, it is an entirely useful glimpse at the constraints and complexities of it all. For the prison-watching community (academic and practitioners alike), the whole exercise also shows how applied social science analysis (i.e. in this case, through constructive use and open reporting of pilots) can play a real-time role in the incremental development of a policy revolution.
Note: This article gives the views of the author, and not the position of the British Politics and Policy blog, nor of the London School of Economics. Please read our comments policy before posting.
 Simon Bastow has a book forthcoming on the England and Wales prison system – ‘Governance, performance, and capacity stress. The chronic case of prison crowding’. Published later in 2013 by Palgrave MacMillan. He has been a Senior Research Fellow at the LSE Public Policy Group since 2005. He was previously at the School of Public Policy, UCL (now the Department of Political Science). He completed his PhD in political science in April 2012, looking at chronic capacity stress and crowding in the England and Wales prison system.


While even a marginal decrease in reoffending is encouraging, these results from such a widely touted experiment question both their use of proven reoffending strategies and the dream that social impact bonds were some cureall way of changing implementation of effective reoffending strategies.
The fundamental flaw in this experiment in crime reduction policy was encapsulated in the British Prime Minister´s statement that ¨Prevention is the most effective and most cost effective way to reduce crime, all the rest is picking up the pieces¨. This was yet another effort to pick up pieces that are difficult to pick up once broken and even harder to put back together (except with aging).
While it is noble to work to reduce reoffending and it must be continued, it is tinkering with protecting victims from crime. It is time to get smarter with crime control and reinvest significantly in proven effective public safety. We know that taking incarceration and reentry to the nth degree has not solved the problems of inner city homicides in the US. So why expect tinkering in the UK to do something different.
Today, we have a wealth of proven strategies that are recognised as effective and cost effective prevention by an accumulation of respected authorities from the US Department of Justice to the World Health Organization. These are mostly social development prevention targeted to problem places, which would stop persons developing into chronic offenders and reduce crime by factors many times greater than 10%!