 How do Westminster election results compare to those of devolved institutions? Ian Simpson looks at how the 2021 election results for the Scottish Parliament, Senedd Cymru, and the London Assembly compare with the results of the previous five sets of Westminster elections. He shows how the Additional Member System, a version of proportional representation that is used across the three devolved institutions, produces much fairer outcomes for voters than the First Past the Post system that is still used for UK general elections.
This May, the sixth set of elections took place for each of the devolved institutions in the nations of Britain – the Scottish Parliament, Senedd Cymru (Welsh Parliament) and the London Assembly. It was a reminder that systems of proportional representation (PR) have now been in use in Britain for over two decades. The Additional Member System (AMS) is used for elections to all three devolved bodies. This system is a combination of First Past the Post (FPTP) single-member constituencies and regional, multi-member constituencies, where a form of Party List PR is used. Once the votes in the FPTP constituencies have been counted and representatives elected, the party list votes in each electoral region, areas that cover a number of FPTP constituencies, are then counted. List seats are distributed with the aim of ensuring that the overall share of seats for each party matches the share of party list votes received, as far as possible.
How do the devolved election results compare with their Westminster results? Our analysis shows the gap in representation under FPTP is stark.
Scotland
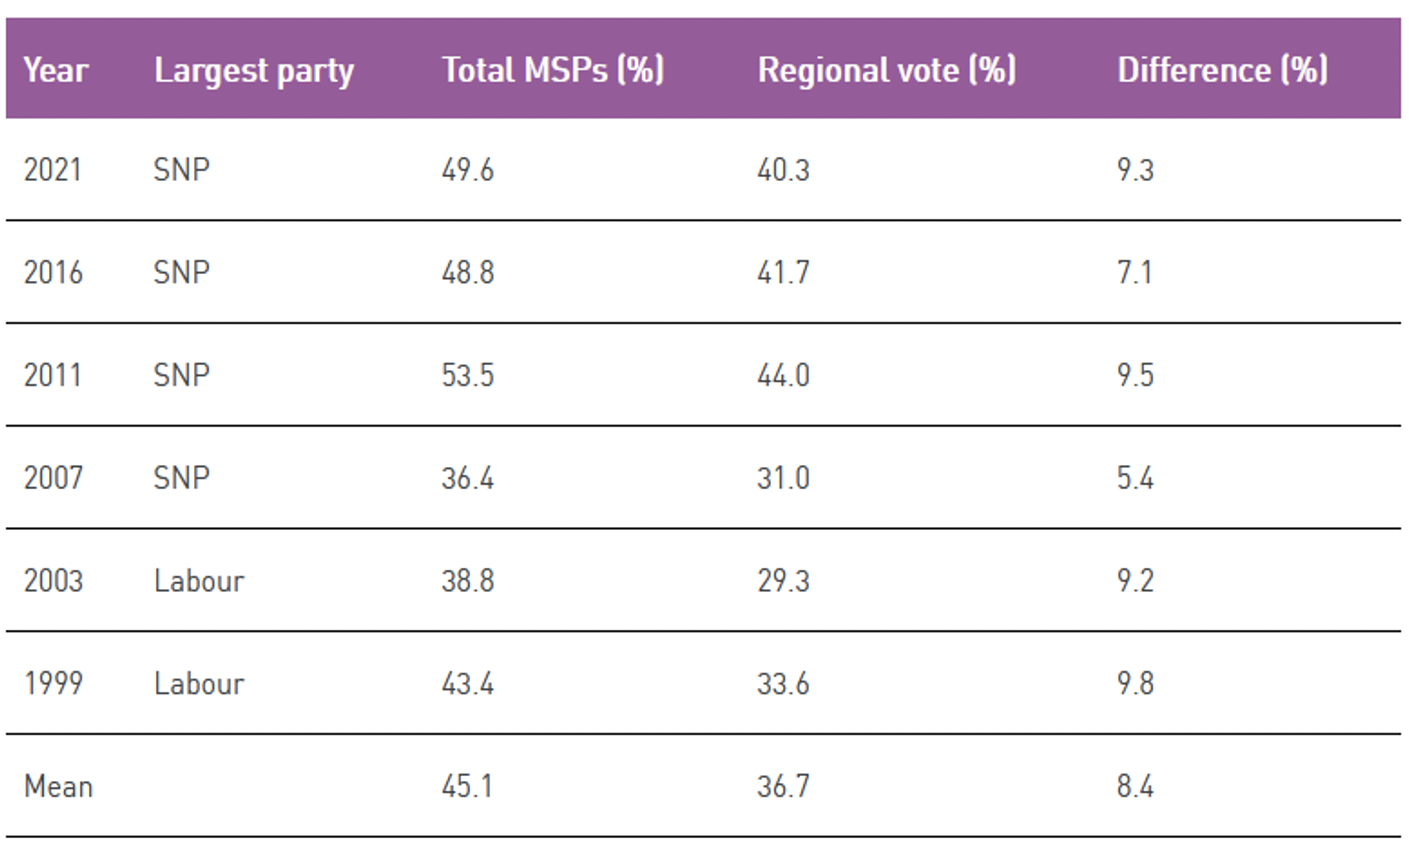
On average, across the last seven UK general elections, the largest party has won 75% of Scottish seats based on just over 43% of votes (see Table 1). Across the six Scottish Parliament elections during the same period, the average result for the largest party is a much fairer at 45% of seats, having received 37% of regional votes (Table 2). The regional vote share is the best data to use for this comparison, as an aim of the AMS system is for the overall proportion of seats to match the regional vote shares as closely as possible.
A common way to measure the overall proportionality of an election result is via a Deviation from Proportionality (DV) score. The DV score shows the extent to which an election result deviates from proportionality, i.e. from what it would look like if seats were proportional to votes gained by each party. It gives a percentage of seats in parliament which are ‘unearned’ in proportional terms. There are various ways of measuring DV scores. We have used the Loosemore-Hanby index, which is calculated by adding up the difference between each party’s vote share and their seat share and dividing by two. This gives a ‘total deviation’ score – the higher the score, the more disproportionate the result.
AMS consistently ensures far more proportional results than we see for Scottish seats at UK general elections, where FPTP is used. Across the last seven UK general elections, the mean DV score for Scotland is 32.3, whereas for Scottish Parliament elections it is just 10.7.
Table 1: Vote share and seat share in FTPT constituency seats, Scottish Parliament election 2021.
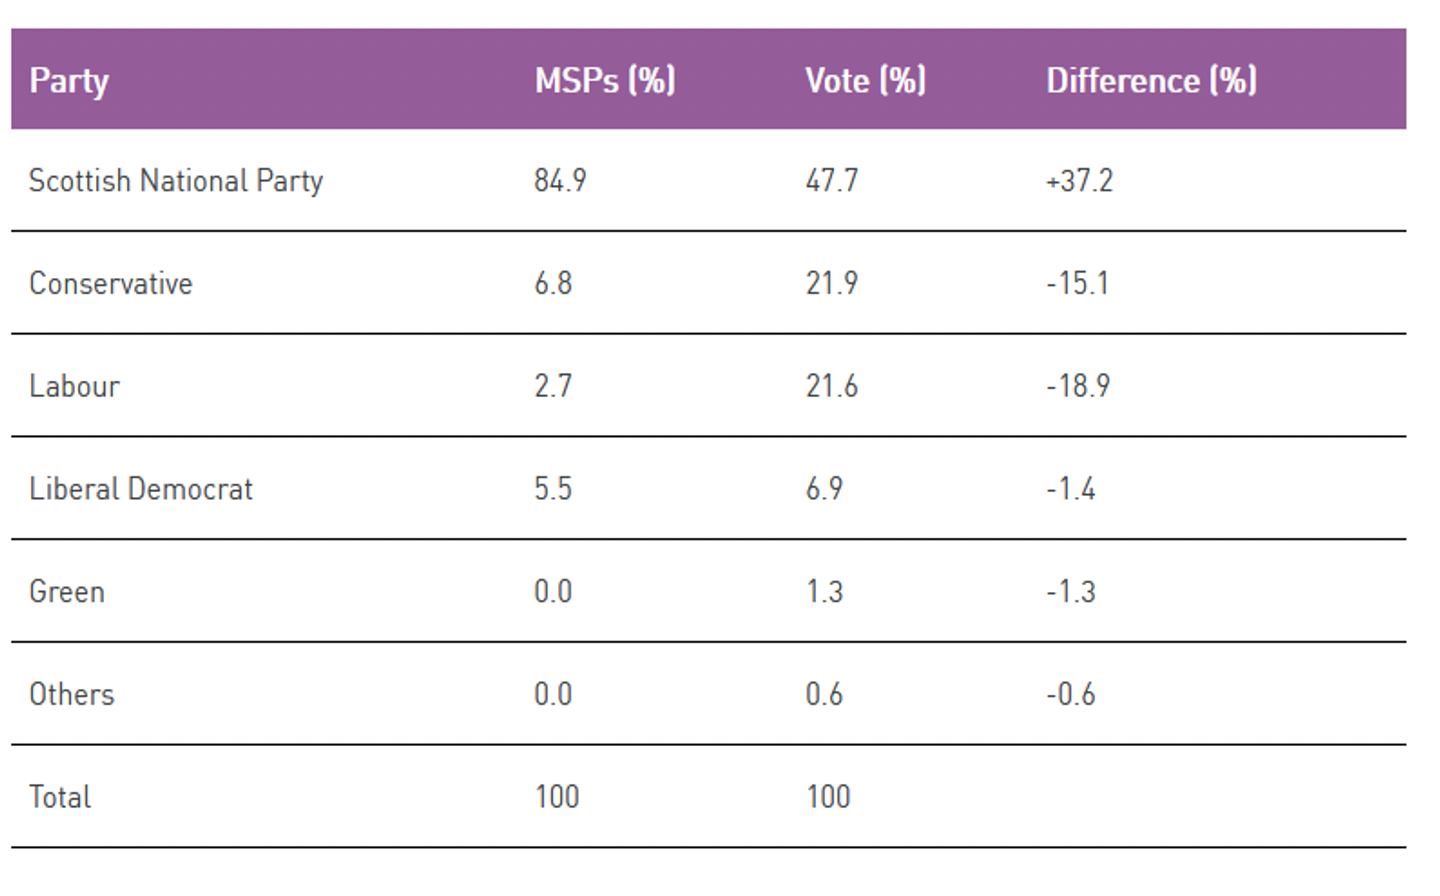
Table 2: Largest party over-representation at Scottish Parliament (AMS) and UK General Elections, 1997-2001.
Wales
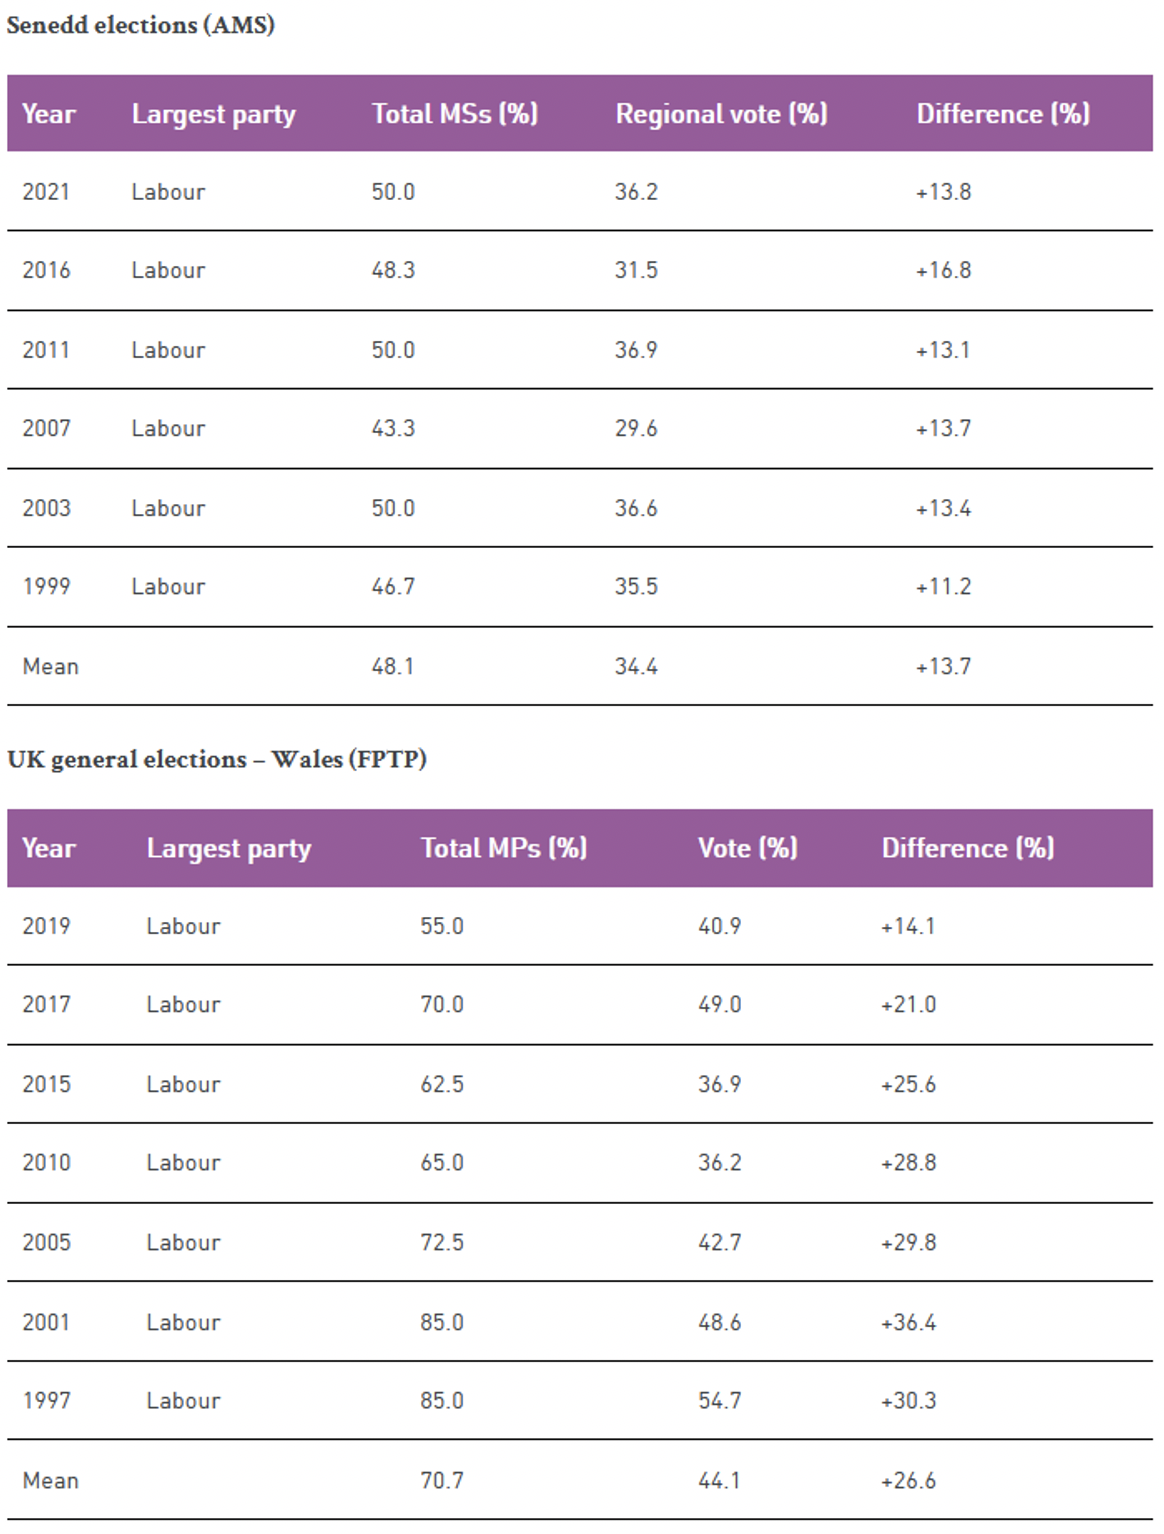
In Wales, the largest party across these last seven UK general elections has on average won just over 70% of seats, based on 44% of votes. In contrast, across the six Senedd elections to date, no party has won a majority of seats, though Labour has won exactly half the seats on three occasions – in 2003, 2011, and 2021. On average, across the six Senedd elections, the largest party has won 48.1% of seats, having received 34.4% of regional list votes, a more proportional outcome than is in evidence at UK general elections in Wales.
Table 3: Largest party over-representation at Senedd and UK general elections in Wales, 1997–2021
The mean DV score for the six Senedd elections is 15.1, more than 10 points lower than the mean score for the last seven UK general elections across Wales, which is 26.9. However, it should be noted that the mean DV score for the six Senedd elections is over four points higher than that of the six Scottish Parliament elections (10.7). One of the reasons for this is the higher proportion of FPTP constituency members in the Senedd, compared to the Scottish Parliament. Whereas 56.6% of MSPs are FPTP constituency representatives, this rises to 66.7% of MSs in the Senedd. Consequently, allocation of the ‘additional’ members provides less scope for balancing out the results from the FPTP constituencies.
Major reform of the Senedd’s electoral system is on the agenda. Recent years have seen two major reports calling for reform, one from the Expert Panel on Assembly Electoral Reform, and the other by the Committee on Senedd Electoral Reform. Both recommend increasing the size of the Senedd to between 80–90 MSs, to acknowledge its increased powers since its creation, and so that the Senedd can properly hold the Welsh government to account. Alongside this proposed enlargement, both reports also recommend replacing the AMS system with the Single Transferable Vote (STV), the Electoral Reform Society’s favoured form of PR.
London
Across the last seven general elections, the largest party in London, always Labour, has won a majority of seats (Table 4). On only one occasion, in 2017, did they win a majority of votes. In contrast, no party has ever won a majority of seats on the London Assembly. The average seat share for the largest party at Assembly elections is 41.7%, on the basis of 34.6% of regional list votes, whereas across the seven UK general elections since 1997, the average is 65.6% of seats, from 45.6% of votes.
Table 4: Largest party over-representation at London Assembly and UK general elections, 1997–2021

As with the other devolved institutions, a comparison of the London Assembly DV score with the DV scores for the relevant portion of UK general elections, shows how the PR system produces overall results that are far fairer than those produced by FPTP. Across the six London Assembly elections, the mean DV score is 12.7, whereas for the last seven UK general elections, in London, the mean DV score is almost twice this, at 20.9.
Conclusion
After more than two decades of proportional representation being used for elections to devolved bodies in each nation of Great Britain, it is clearer than ever that FPTP for UK general elections is an outdated anomaly, creating wildly unrepresentative results, as this table shows. Not only are the devolved parliamentary elections in Scotland and Wales run under PR, but both parliaments have legislated for the further expansion of PR systems into local elections in each country. In Scotland, there have already been three sets of local elections held under STV and Welsh councils will have the opportunity to move to STV for their elections, after the next set of Welsh local elections in 2022.
Now that European Parliament elections no longer take place, voters in England, outside of London, no longer have the opportunity of taking part in elections held using PR systems. English voters are stuck with the outdated and unfair FPTP system for both UK general elections and for their local elections.
More than 20 years of experience have shown that voters in all parts of Britain can easily use and understand PR systems, and many greatly value the benefits that these systems bring. It is long overdue that all elections in the UK were run via proportional representation, with Westminster’s one-party-takes-all politics consigned to history.
____________________
Note: Read the full report from the Electoral Reform Society on which the above draws here.
Ian Simpson is Research Officer at the Electoral Reform Society.
Photo by Phil Scroggs on Unsplash.