

 As a general election approaches, parties want to know not only how many seats they will win but also which ones. Some argue that the best source of such information is the voters in the individual seats because they are more aware of trends in local opinion; so ask enough of them and the ‘wisdom of the crowds’ will indicate the expected winner. Ron Johnston, Charles Pattie, and Todd Hartman test that argument using data for the ‘Red Wall’ constituencies that Labour lost to the Conservatives in 2019.
With the increased volume of polling and survey data available, and the greater sophistication of methods available for their analysis, predictions and forecasts are increasingly being produced not just for the likely result of a general election nationally but also for individual constituencies; there is a greater focus on the local.
One approach argues that the people who live in the local area know best the likely outcome there – the ‘wisdom of the crowd’ as it is sometimes called. They are aware, through their social and other contacts, of local trends in public opinion and have a good impression of which party is likely to win in their home constituency. Individuals there may vary in their estimates of the likely winner depending on the contents of their social networks, but in the aggregate, the likely winner will be correctly identified by a substantial sample of the local electorate.
The 2019 general election in England provides a useful test case of this argument. The Conservative Party won a substantial number of seats in constituencies in the northern regions that had traditionally returned Labour MPs over long periods. Were the local voters aware that this was going to happen? And did they become convinced that it would as the campaign continued and the Conservatives’ apparent likelihood of defeating Labour in some of what became known as the northern ‘Red Wall’ constituencies became increasingly likely according to national polls?
The British Election Study surveys provide the data with which those questions can be addressed. At both the pre-election wave (17), conducted after the election date was announced, between 1 November and 12 November 2019, and the daily rolling panel survey comprising sub-samples of those initially surveyed (Wave 18), conducted between 13 November and 11 December 2019, respondents were asked the following question: How likely is it that each of these parties will win the General Election in your local constituency? Respondents provided their forecast using a scale ranging from 0 (very unlikely to win) to 100 (very likely to win).
We use those data for the 1955 respondents in the 43 constituencies in England’s five northern regions (Northeast, Northwest, Yorkshire and the Humber, East Midlands, and West Midlands) that were won by Labour at the 2017 general election and the Conservatives in 2019. We look only at their estimates of the likelihood of either a Labour or a Conservative victory.
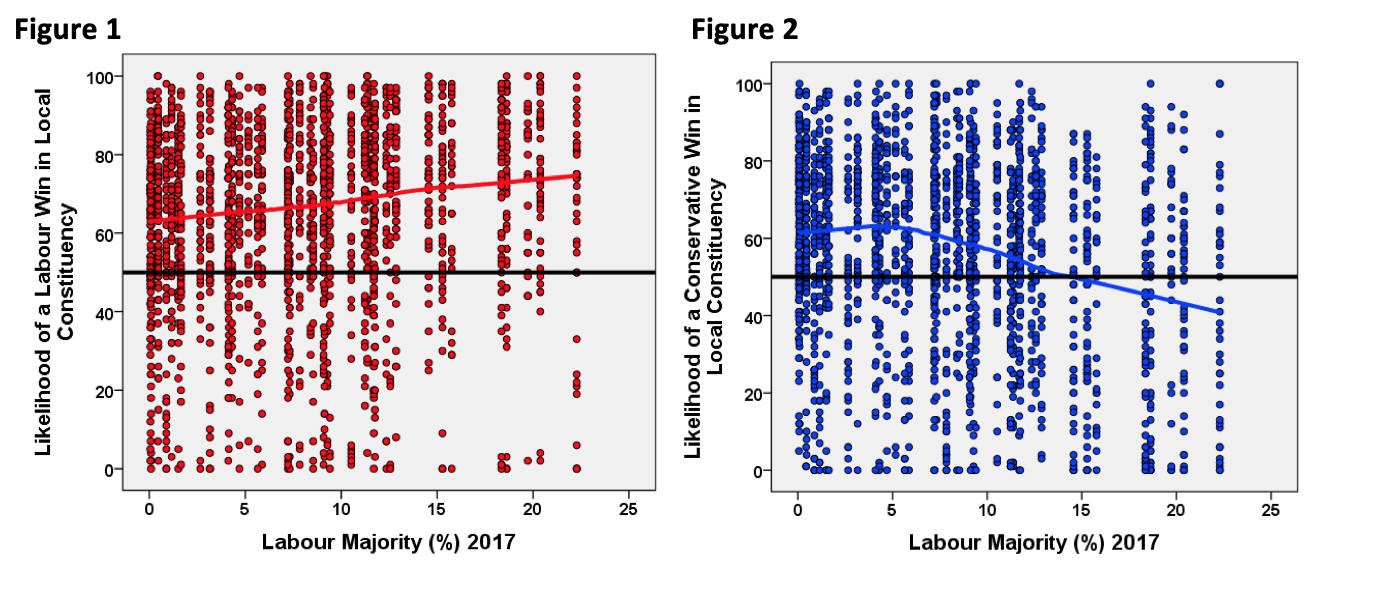 Figure 1 shows the pre-campaign estimates of a Labour victory from each of the 1955 respondents, according to their home constituency’s Labour majority in 2017, with the red line showing the moving average across constituencies. In all of them the average estimate was above 60, increasing with the size of Labour’s 2017 majority. At the start of the campaign, most voters thought there was a greater than 50:50 chance of a Labour victory again in all 43 seats.
But respondents did not use the 0-100 scale as a zero sum – if the estimate of a Labour victory was 60, then that of a Conservative victory could be no more than 40. As Figure 2 shows, many of their estimates of a Conservative victory were also greater than 50; indeed, the average exceeded that in all constituencies with a 2017 Labour majority of less than 15 percentage points. Local voters thought there was a good chance of a Conservative victory too in many of those seats.

But which party was most likely to win? Figure 3 shows for each respondent their estimate of a Labour victory minus that of a Conservative victory. A positive value indicates a Labour victory was the more likely; a negative value a Conservative victory. The moving average line shows that even in the most marginal of Labour-held seats, respondents thought a Labour victory again was more likely than a Conservative gain, though only very slightly. Of course, there is both sampling and measurement error associated with these estimates and more formal statistical modelling with confidence intervals – not possible with moving averages – would probably indicate a strong likelihood of a Conservative rather than Labour victory in those marginal seats: respondents in the seats Labour just held on to in 2017 in effect thought either party might win there before the 2019 campaign started.
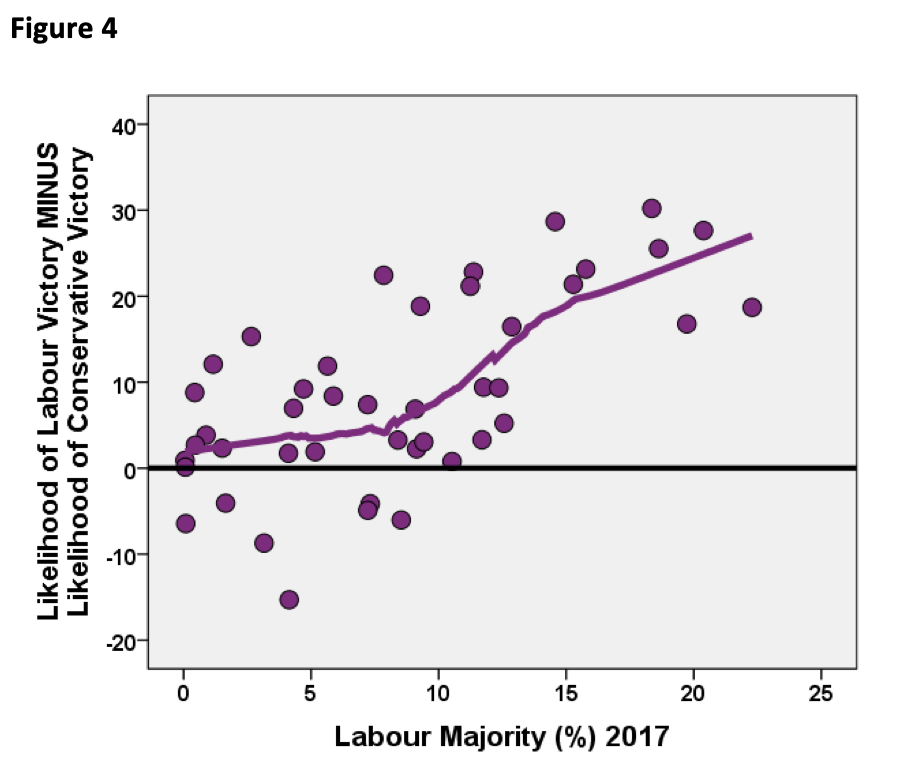 And was that the wisdom of the crowd in each constituency too – what was the aggregate opinion in each of the 43 constituencies? Figure 4 shows the mean (Labour minus Conservative) expectation for each across all respondents there. There were only seven marginal constituencies where a Conservative gain was considered more likely than Labour retaining the seat; in the majority of seats when the election was called, local voters thought a Labour victory the most likely.
But what happened during the campaign? The Poll of Polls shows that on 1 November 2019 Labour was supported by 27% and the Conservatives by 38%. The gap between the two remained fairly constant between then and the election on 12 December, when their respective shares of the votes cast were 32% and 44%. A Conservative victory was thus widely expected nationally, with presumably many of the Labour-held marginal seats in its ‘Red Wall’ being lost. Was this reflected in the local voters’ estimates there?
The BES rolling survey (Wave 18) asked the same questions as the pre-campaign survey, but of only small sub-samples on each day. These have been aggregated here into four periods of equal length, which gives samples of around 400 respondents in each (i.e. less than 10 per constituency hence we do not aggregate the data by constituency).
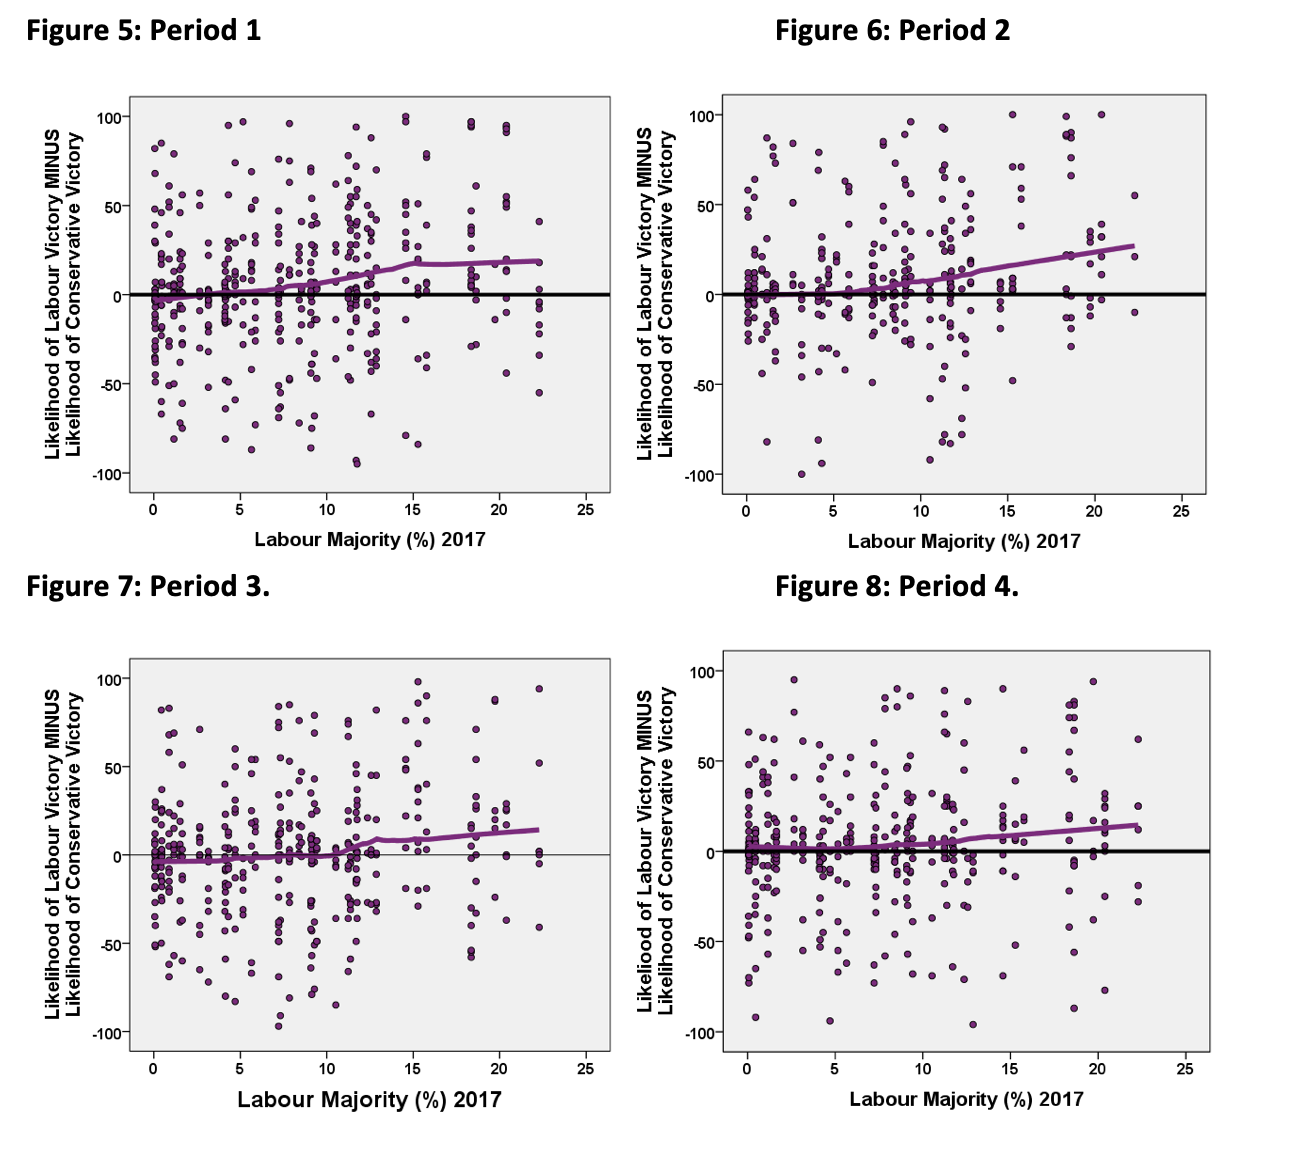 Figures 5-8 show the (Labour minus Conservative) estimates for the four time periods. Compared to the pre-campaign pattern (Figure 3) they show that even in the least marginal seats respondents were less sure that Labour would retain the seat. In the more marginal – those won by less than ten percentage points in 2017 – the likelihood of a Labour victory again was almost the same as that of a Conservative gain: indeed, in the third period (late in November) on average a Conservative gain was considered slightly more likely. Over the four periods, however, the main change was in Labour’s safer seats where on average there was a larger decline in respondents’ views on its likelihood of winning again than there was in the more marginal seats; they became less confident of a Labour victory in constituencies won by 15 points or more in 2017 as the campaign proceeded, whereas there was little change in the most marginal – respondents thought those seats could go either way.
This preliminary analysis of the BES data shows that in those north of England ‘Red Wall’ seats, local voters became less sure that Labour would retain them as the 2019 campaign progressed – especially the most marginal constituencies. They were aware that the tide was turning against Labour there. Nevertheless, they still – in most cases – believed that Labour would win there again. And yet all of those seats were lost. The local crowds saw which way voter preferences were shifting, but failed to recognise to what extent.
This provides evidence that in general supports the ‘wisdom of the crowds’ argument: respondents in the ‘Red Wall’ constituencies saw the writing on the wall. It raises further questions for later analysis, however. Was it the same in the other northern seats that Labour nevertheless won again in 2019? (Most of those were less marginal than those lost. Several were in particular types of seat. Only one of the seats Labour lost to the Conservatives was in one of the main cities – Birmingham Northfield; all of the others in Birmingham, plus those in Leeds, Liverpool, Sheffield, Manchester and Newcastle upon Tyne were held by Labour.) And who were the more convinced that Labour would win again: its supporters? The crowd may have an aggregate opinion, but with considerable internal variation.
____________________
Ron Johnston is Professor in the School of Geographical Sciences at the University of Bristol.
Charles Pattie is Professor in the Department of Politics at the University of Sheffield.
Todd Hartman is Senior Lecturer in the Sheffield Methods Institute at the University of Sheffield.
All articles posted on this blog give the views of the author(s), and not the position of LSE British Politics and Policy, nor of the London School of Economics and Political Science. Featured image credit: Patrick Tomasso on Unsplash


1 Comments